
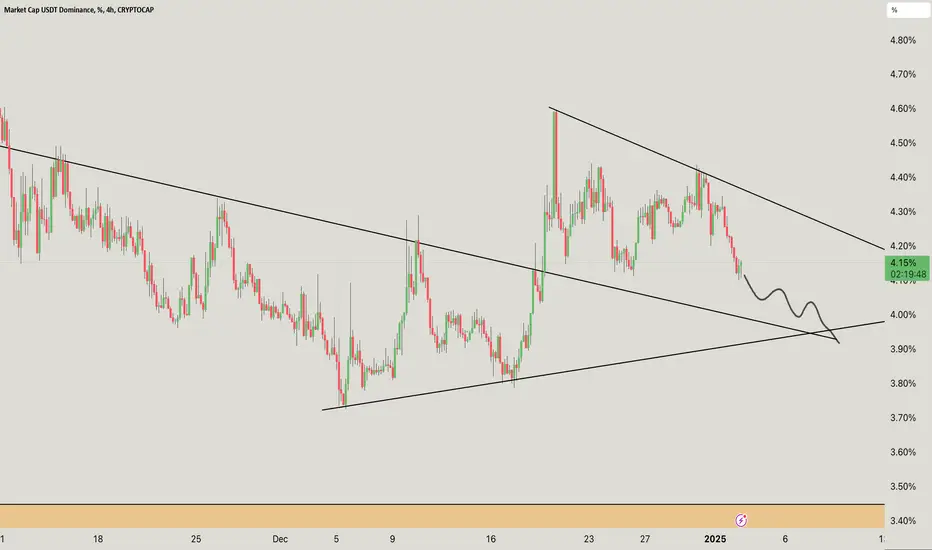
USDT dominance (USDT.D) appears to form a descending triangle or wedge pattern, with two converging trendlines indicating a potential breakdown.
The upper trendline is descending, indicating consecutive lower highs.
The lower trendline is relatively flat, but rising slightly.
USDT.D is approaching the lower trendline, indicating potential support.
The path drawn indicates a potential breakdown below the lower trendline.
Downward continuation is anticipated in the orange zone (3.40%–3.10%).
Resistance: ~4.20%
Support: ~3.90% and orange zone around 3.40%–3.10%
If USDT dominance falls, it usually suggests that traders move capital from stablecoins (USDT) to riskier assets like Bitcoin or altcoins, indicating a potential bullish sentiment in the broader crypto market.
Let me know if you’d like further assistance or adjustments!
DYOR. NFA

関連の投稿
免責事項
これらの情報および投稿は、TradingViewが提供または承認する金融、投資、取引、またはその他の種類の助言もしくは推奨であることを意図したものではなく、またこれらに該当するものでもありません。詳細は利用規約をご覧ください。
関連の投稿
免責事項
これらの情報および投稿は、TradingViewが提供または承認する金融、投資、取引、またはその他の種類の助言もしくは推奨であることを意図したものではなく、またこれらに該当するものでもありません。詳細は利用規約をご覧ください。