
USDT Dominance – Chart Update
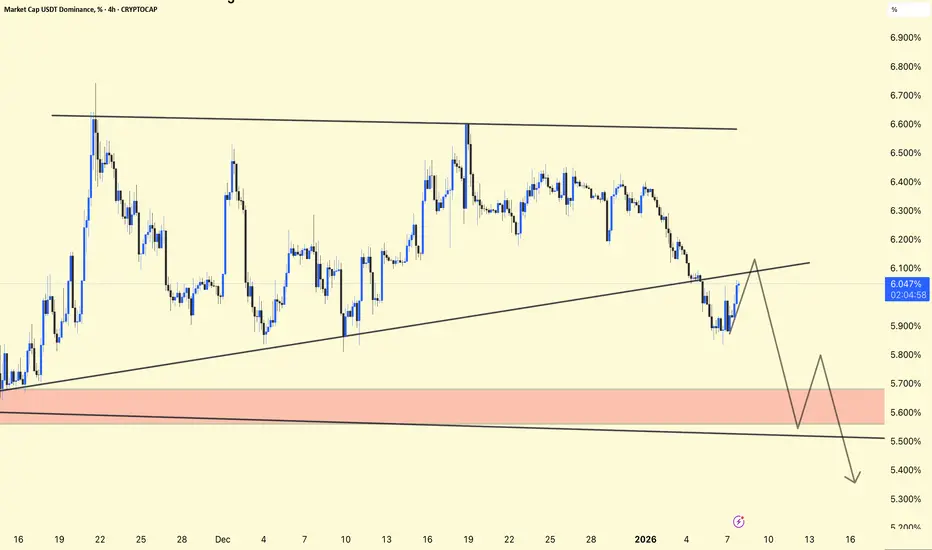
USDT.D is currently holding an ascending trendline support
A short-term bounce or pullback is possible from this area
Overall structure still shows a bearish bias
Resistance: 6.10% – 6.20%
Major Support / Demand Zone: 5.60% – 5.55%
Rejection from 6.10–6.20% → Positive for altcoins
Break and hold above resistance → Market may turn risk-off short term
USDT Dominance is gradually showing downside pressure.
A clean breakdown below 5.60% could signal a strong altcoin rally.
For educational purposes only. Not financial advice.

関連の投稿
免責事項
これらの情報および投稿は、TradingViewが提供または承認する金融、投資、取引、またはその他の種類の助言もしくは推奨であることを意図したものではなく、またこれらに該当するものでもありません。詳細は利用規約をご覧ください。
関連の投稿
免責事項
これらの情報および投稿は、TradingViewが提供または承認する金融、投資、取引、またはその他の種類の助言もしくは推奨であることを意図したものではなく、またこれらに該当するものでもありません。詳細は利用規約をご覧ください。