
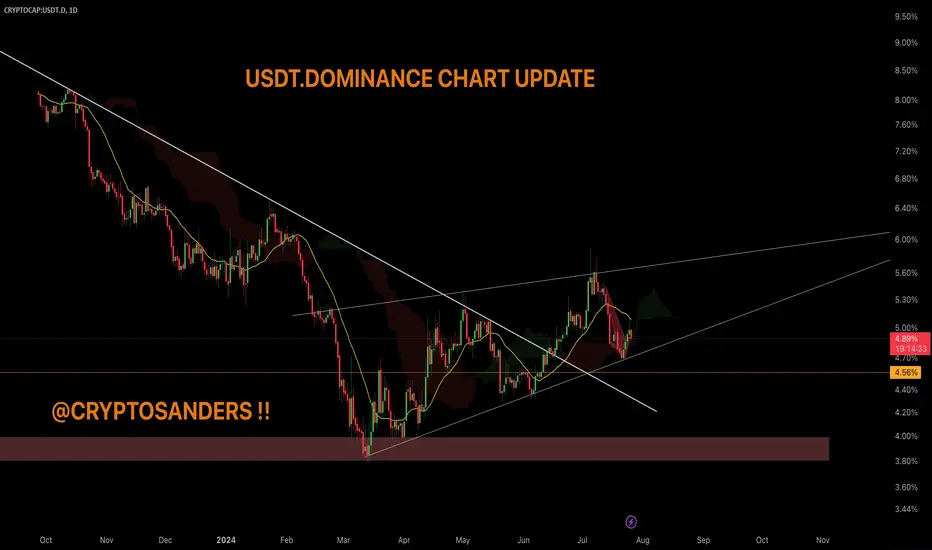
The 21-day moving average acts as resistance indicating that the price needs to move above this level to regain bullish momentum.
If USDTD breaks below the support trendline of the rising wedge and drops below the Ichimoku Cloud, it would confirm the bearish trend.
This scenario would likely correspond to a bullish move in the broader crypto market, as USDT.D moves opposite to major cryptocurrencies like BTC and ETH.
USDT.D could continue to consolidate within the triangle formed by the rising wedge. This would involve sideways movement with possible minor fluctuations, indicating uncertainty and a lack of strong directional bias.
Less likely given the rising wedge pattern, a sustained move above the 21 MA and sustaining above the Ichimoku Cloud would signal renewed bullish strength for USDT.D, potentially signaling a bearish trend for the broader crypto market.
Bearish Indicators: A potential breakdown below the rising wedge pattern and the Ichimoku Cloud indicates a bearish outlook for USDTD.
Remember: This is not financial advice. Stay tuned to us for further updates and analysis. Thank you!

関連の投稿
免責事項
これらの情報および投稿は、TradingViewが提供または承認する金融、投資、取引、またはその他の種類の助言もしくは推奨であることを意図したものではなく、またこれらに該当するものでもありません。詳細は利用規約をご覧ください。
関連の投稿
免責事項
これらの情報および投稿は、TradingViewが提供または承認する金融、投資、取引、またはその他の種類の助言もしくは推奨であることを意図したものではなく、またこれらに該当するものでもありません。詳細は利用規約をご覧ください。