
USDT DOMINANCE ANALYSIS
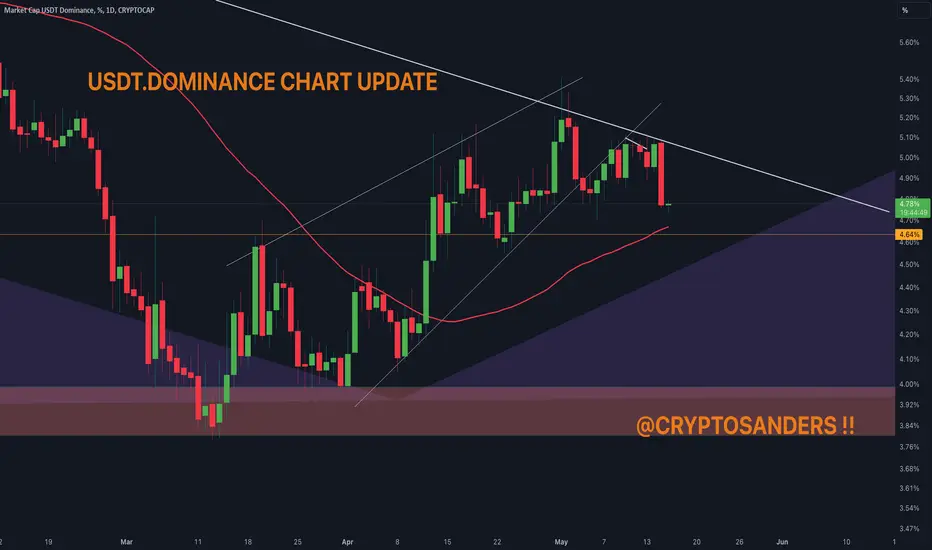
USDT.D is descending following a retest below the rising wedge. It's also breaking through the MA 50, with a candle close below it confirming a bearish sentiment. Notably, a bearish USDTD trend often indicates bullish momentum for the broader crypto market due to their inverse relationship.
I have tried to bring the best possible results in this chart.
If you like it, hit the like button and share your charts in the comments section.
Thank you.
USDT.D is descending following a retest below the rising wedge. It's also breaking through the MA 50, with a candle close below it confirming a bearish sentiment. Notably, a bearish USDTD trend often indicates bullish momentum for the broader crypto market due to their inverse relationship.
I have tried to bring the best possible results in this chart.
If you like it, hit the like button and share your charts in the comments section.
Thank you.

関連の投稿
免責事項
これらの情報および投稿は、TradingViewが提供または承認する金融、投資、取引、またはその他の種類の助言もしくは推奨であることを意図したものではなく、またこれらに該当するものでもありません。詳細は利用規約をご覧ください。
関連の投稿
免責事項
これらの情報および投稿は、TradingViewが提供または承認する金融、投資、取引、またはその他の種類の助言もしくは推奨であることを意図したものではなく、またこれらに該当するものでもありません。詳細は利用規約をご覧ください。