
Well, my last analysis on this chart came true!
as I mentioned frequently, the market is struggling to resist of falling more deep! specially BTC (Leader) needs to hold its support levels and the thing is happening is pumping good news around BTC by influencers to push the market up and sell in more highs and buy the dip again ;) this is so called Bull trap wave
anyway, I don' care about news! each level has its own function and if you know Price action, you can use all movements of the market!
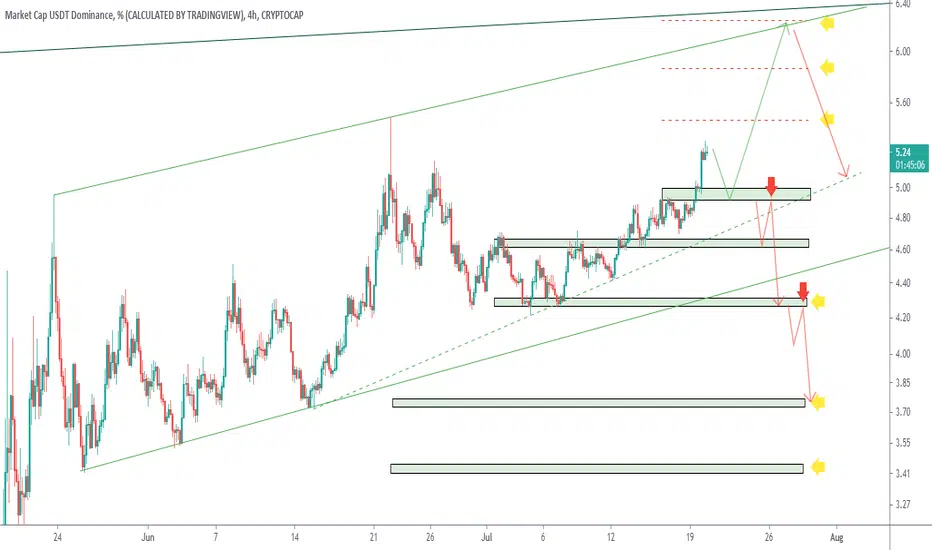
About the chart, I predict it can reach the level 6.24 finally, hence we could have a big bearish movement in whole market!
The level 4.92-5.0 is a nice support area, it needs this level stable for its recent uptrend
And if this index reaches the level 6.24, it can fall down rapidly ( because many buy limit orders have been placed in dip )
as I mentioned frequently, the market is struggling to resist of falling more deep! specially BTC (Leader) needs to hold its support levels and the thing is happening is pumping good news around BTC by influencers to push the market up and sell in more highs and buy the dip again ;) this is so called Bull trap wave
anyway, I don' care about news! each level has its own function and if you know Price action, you can use all movements of the market!
About the chart, I predict it can reach the level 6.24 finally, hence we could have a big bearish movement in whole market!
The level 4.92-5.0 is a nice support area, it needs this level stable for its recent uptrend
And if this index reaches the level 6.24, it can fall down rapidly ( because many buy limit orders have been placed in dip )
トレード終了: 利益確定目標に到達
New analysis has been published
関連の投稿
免責事項
これらの情報および投稿は、TradingViewが提供または承認する金融、投資、取引、またはその他の種類の助言もしくは推奨であることを意図したものではなく、またこれらに該当するものでもありません。詳細は利用規約をご覧ください。
関連の投稿
免責事項
これらの情報および投稿は、TradingViewが提供または承認する金融、投資、取引、またはその他の種類の助言もしくは推奨であることを意図したものではなく、またこれらに該当するものでもありません。詳細は利用規約をご覧ください。