
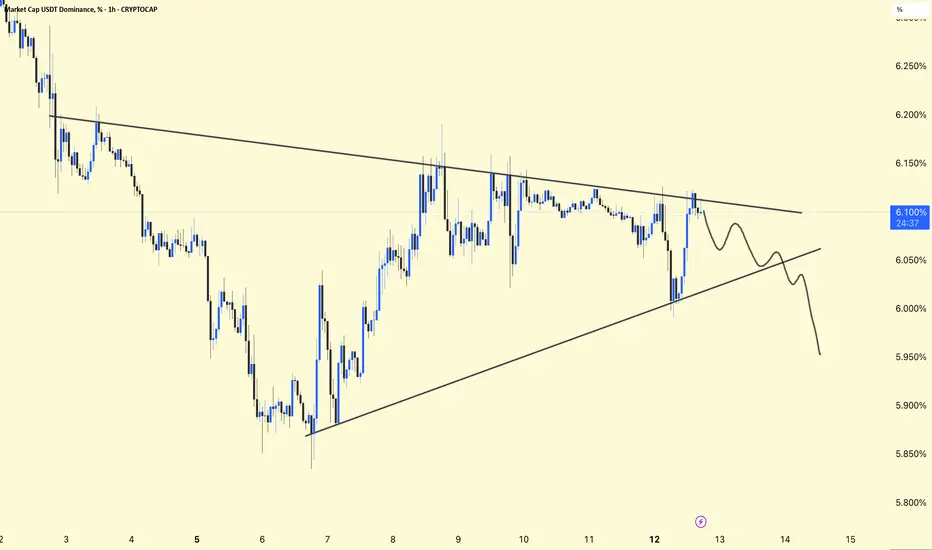
USDT Dominance (1H) – Chart Update
USDT.D is trading inside a symmetrical triangle, formed by a descending resistance and rising support — indicating market indecision.
Price is hovering near the upper half of the pattern, facing rejection from the descending trendline around 6.10–6.15%.
Likely move toward the rising support, which would favor risk-on sentiment and support altcoins.
Signals risk-off, increasing chances of market pullback.
Confirms capital rotation into crypto, bullish for BTC & alts.
USDT.D is at a decision point. A confirmed breakout or breakdown will define the next short-term direction for the broader crypto market. Risk management is key until clarity emerges.
USDT.D is trading inside a symmetrical triangle, formed by a descending resistance and rising support — indicating market indecision.
Price is hovering near the upper half of the pattern, facing rejection from the descending trendline around 6.10–6.15%.
Likely move toward the rising support, which would favor risk-on sentiment and support altcoins.
Signals risk-off, increasing chances of market pullback.
Confirms capital rotation into crypto, bullish for BTC & alts.
USDT.D is at a decision point. A confirmed breakout or breakdown will define the next short-term direction for the broader crypto market. Risk management is key until clarity emerges.
ノート
トレード稼働中

関連の投稿
免責事項
これらの情報および投稿は、TradingViewが提供または承認する金融、投資、取引、またはその他の種類の助言もしくは推奨であることを意図したものではなく、またこれらに該当するものでもありません。詳細は利用規約をご覧ください。
関連の投稿
免責事項
これらの情報および投稿は、TradingViewが提供または承認する金融、投資、取引、またはその他の種類の助言もしくは推奨であることを意図したものではなく、またこれらに該当するものでもありません。詳細は利用規約をご覧ください。