
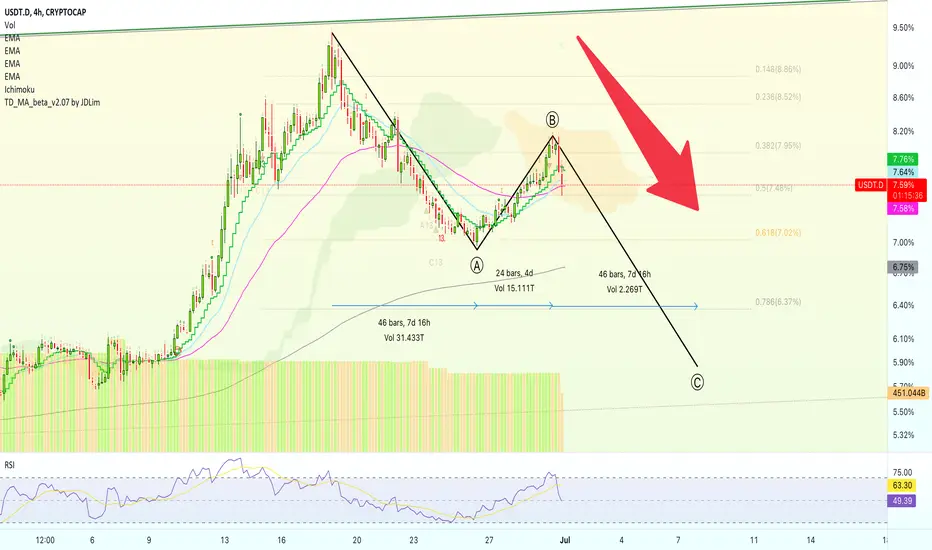
Looks like we have the complete b wave of the ABC correction we mapped a few days ago.
We can see EMA50 holding as support after a higher low.
This is set at 7.58%; This level is very likely to fail.
The RSI has gone bearish (below 50) and we have a clear lower high.
The next target is set first at 7.02% followed by 6.37%.
If we see straight down, as the chart is saying, Bitcoin will move straight up.
Namaste.

✅ Cryptocurrencies technical analysis & results
t.me/masteranandatrades/9279
✅ Stocks technical analysis
t.me/anandastocks
✅ Enjoyed the content? Join my PREMIUM channels for more... t.me/lamatrades/4 (since 2017)
t.me/masteranandatrades/9279
✅ Stocks technical analysis
t.me/anandastocks
✅ Enjoyed the content? Join my PREMIUM channels for more... t.me/lamatrades/4 (since 2017)
関連の投稿
免責事項
これらの情報および投稿は、TradingViewが提供または承認する金融、投資、取引、またはその他の種類の助言もしくは推奨であることを意図したものではなく、またこれらに該当するものでもありません。詳細は利用規約をご覧ください。