
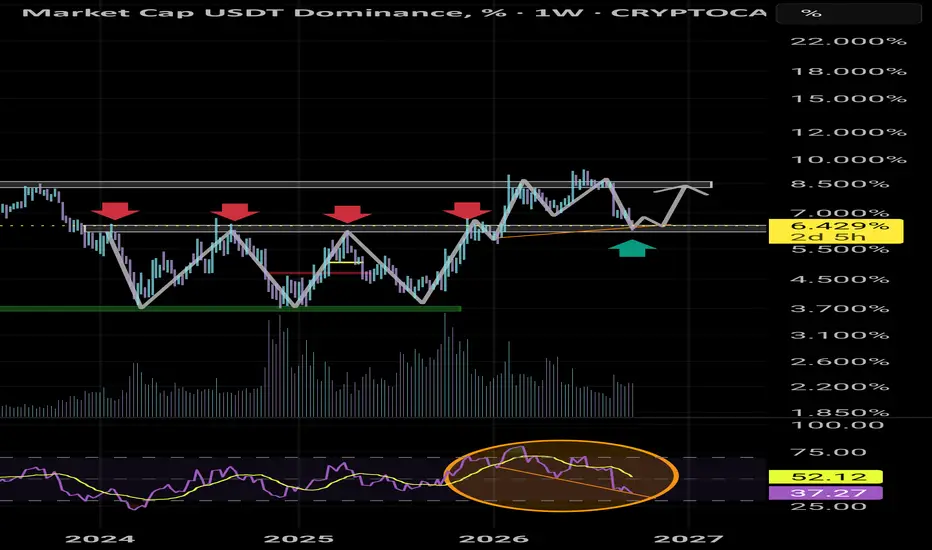
As we can see on the weekly chart we are pulling back to the area that counted as resistance 4 times as marked on the chart previously when USDT.D was below it.
Also weekly RSI is putting in lower lows and price is putting in higher lows which is a bullish divergence and we can't ignore it since the time frame is a Weekly chart. There is no way we'll be breaking a support which counted as resistance 4 times before.
My guess is that we'll have some consolidation or maybe a fake breakdown before shooting back up to the higher area marked on the chart. In my opinion a very big crash will happen soon.
Invalidation is if we break the current weekly support and close below it and only then the bull market will start and that's when I'll enter into BTC and ETH.
DYOR
Goodluck
Also weekly RSI is putting in lower lows and price is putting in higher lows which is a bullish divergence and we can't ignore it since the time frame is a Weekly chart. There is no way we'll be breaking a support which counted as resistance 4 times before.
My guess is that we'll have some consolidation or maybe a fake breakdown before shooting back up to the higher area marked on the chart. In my opinion a very big crash will happen soon.
Invalidation is if we break the current weekly support and close below it and only then the bull market will start and that's when I'll enter into BTC and ETH.
DYOR
Goodluck

免責事項
これらの情報および投稿は、TradingViewが提供または承認する金融、投資、取引、またはその他の種類の助言もしくは推奨であることを意図したものではなく、またこれらに該当するものでもありません。詳細は利用規約をご覧ください。
免責事項
これらの情報および投稿は、TradingViewが提供または承認する金融、投資、取引、またはその他の種類の助言もしくは推奨であることを意図したものではなく、またこれらに該当するものでもありません。詳細は利用規約をご覧ください。