
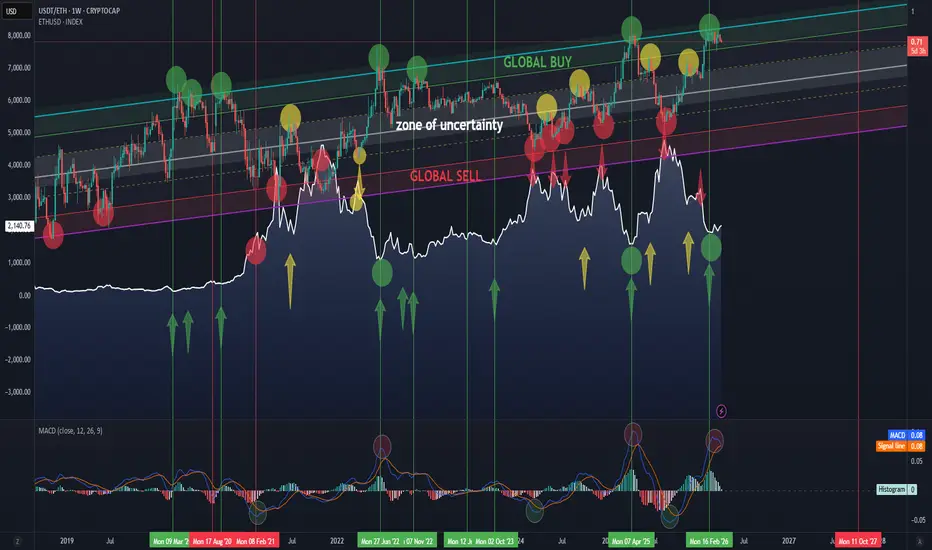
The chart speaks for itself.
USDT/ETH is shown on top, with ETH below for behavioral comparison.
Global buy and sell zones are clearly marked.
MACD is included to help identify the current market phase and understand where we are within the cycle.
And if Trump says everything is “super bad” — isn’t that actually a good buying opportunity?

関連の投稿
免責事項
これらの情報および投稿は、TradingViewが提供または承認する金融、投資、取引、またはその他の種類の助言もしくは推奨であることを意図したものではなく、またこれらに該当するものでもありません。詳細は利用規約をご覧ください。
関連の投稿
免責事項
これらの情報および投稿は、TradingViewが提供または承認する金融、投資、取引、またはその他の種類の助言もしくは推奨であることを意図したものではなく、またこれらに該当するものでもありません。詳細は利用規約をご覧ください。