

🔺 Overview
⸻⸻⸻⸻⸻⸻⸻⸻⸻
📈 Key Price Action
⸻⸻⸻⸻⸻⸻⸻⸻⸻
📊 Chart Explanation
⸻⸻⸻⸻⸻⸻⸻⸻⸻
👀 Observation
⸻⸻⸻⸻⸻⸻⸻⸻⸻
🔮 Future Outlook
⸻⸻⸻⸻⸻⸻⸻⸻⸻
🧠 Summary
⸻⸻⸻⸻⸻⸻⸻⸻⸻
⚠️ Disclaimer
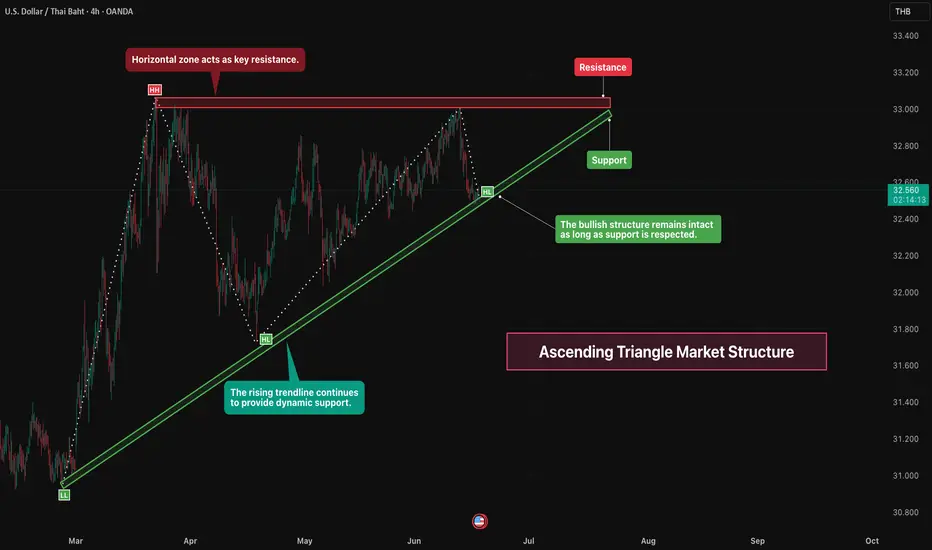
This chart highlights an ascending triangle market structure, where price is trading between a rising support trendline and a horizontal resistance zone. The pattern reflects strengthening demand as higher lows continue to develop.
⸻⸻⸻⸻⸻⸻⸻⸻⸻
📈 Key Price Action
• Higher lows indicate sustained buying pressure.
• Price continues to respect the rising trendline support.
• Multiple tests of the resistance zone confirm its significance.
• The market remains compressed between support and resistance.
⸻⸻⸻⸻⸻⸻⸻⸻⸻
📊 Chart Explanation
• The rising trendline continues to provide dynamic support.
• The horizontal zone acts as a key resistance area.
• Higher lows reinforce the bullish market structure.
• The ascending triangle pattern remains valid while support holds.
⸻⸻⸻⸻⸻⸻⸻⸻⸻
👀 Observation
• Buyers continue defending higher price levels.
• Resistance remains the key level to watch.
• Price is approaching a decision area between support and resistance.
• Volatility may expand as price moves closer to the triangle apex.
⸻⸻⸻⸻⸻⸻⸻⸻⸻
🔮 Future Outlook
• Holding above support may favor continued bullish structure.
• A breakout above resistance could strengthen upward momentum.
• A loss of trendline support may weaken the current market structure.
• Confirmation through candle closing behavior can improve reliability.
⸻⸻⸻⸻⸻⸻⸻⸻⸻
🧠 Summary
Price remains within an ascending triangle structure, supported by a rising trendline and capped by a well-defined resistance zone. The current market structure remains constructive while support is respected.
⸻⸻⸻⸻⸻⸻⸻⸻⸻
⚠️ Disclaimer
📘 For educational purposes only.
🙅 Not SEBI registered.
❌ Not a buy/sell recommendation.
🧠 Purely a learning resource.
📊 Not Financial Advice.

Pine Script Developer • Market Analysis
免責事項
これらの情報および投稿は、TradingViewが提供または承認する金融、投資、取引、またはその他の種類の助言もしくは推奨であることを意図したものではなく、またこれらに該当するものでもありません。詳細は利用規約をご覧ください。
Pine Script Developer • Market Analysis
免責事項
これらの情報および投稿は、TradingViewが提供または承認する金融、投資、取引、またはその他の種類の助言もしくは推奨であることを意図したものではなく、またこれらに該当するものでもありません。詳細は利用規約をご覧ください。