

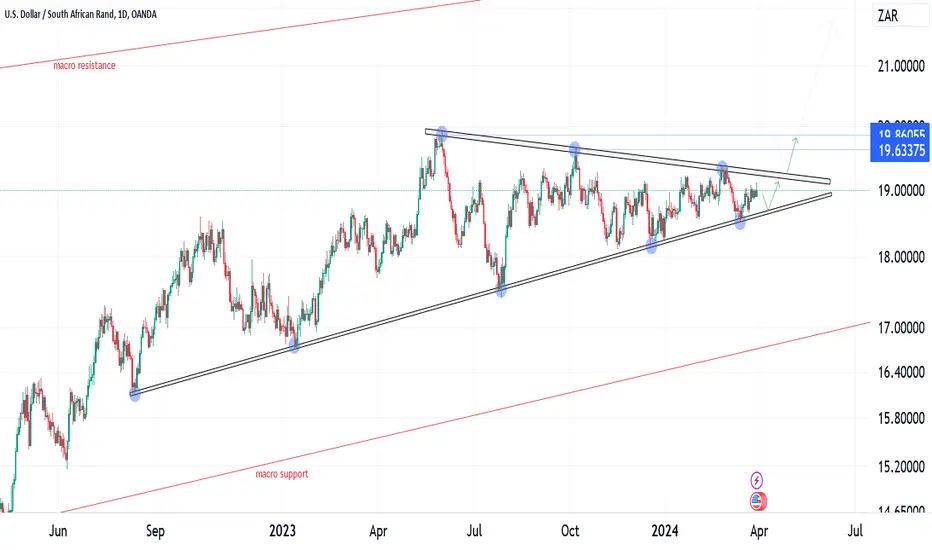
USDZAR on the daily timeframe presents an intriguing technical setup characterized by the formation of an ascending triangle pattern. An ascending triangle typically indicates a bullish bias in the market sentiment. Consequently, there are two potential scenarios to consider.
In terms of targets, should the bullish scenario materialize, the price may aim for levels between 19.63 and 19.86.
- Firstly, the price action may encounter support around the lower boundary of the ascending triangle, leading to a rebound. This suggests a favorable opportunity for traders to enter long positions as the price bounces off the support level.
- Alternatively, there exists the possibility of a breakout above the upper boundary of the ascending triangle. Such a move would signify a bullish continuation pattern, likely propelling the price higher.
In terms of targets, should the bullish scenario materialize, the price may aim for levels between 19.63 and 19.86.

免責事項
これらの情報および投稿は、TradingViewが提供または承認する金融、投資、取引、またはその他の種類の助言もしくは推奨であることを意図したものではなく、またこれらに該当するものでもありません。詳細は利用規約をご覧ください。
免責事項
これらの情報および投稿は、TradingViewが提供または承認する金融、投資、取引、またはその他の種類の助言もしくは推奨であることを意図したものではなく、またこれらに該当するものでもありません。詳細は利用規約をご覧ください。