

Unum flash note on the USDZAR from our Trading Desk analyst, Lester Davids.
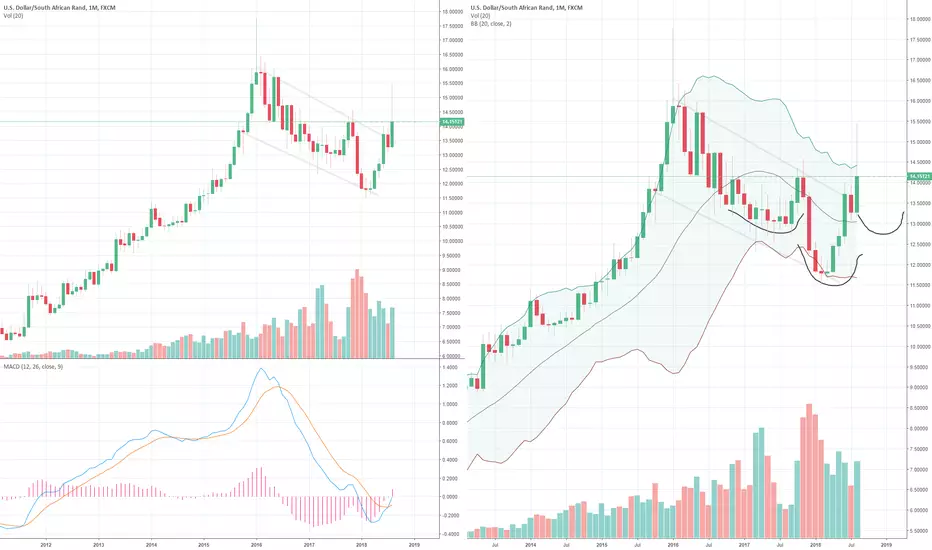
Chart 1: USDZAR: We currently trade just below the R14.25 resistance, with the Rand having gained on a weaker USD. The monthly chart shows this to be the top of the bull flag/channel.
Chart 2: Another view (again the monthly chart), shows the potential start of a "right shoulder" of a long term inverse H&S formation.
support and resistance levels from the bank analysts (Investec) this morning confirm these ranges (R1 14.2430, S1 14.15)
Chart 1: USDZAR: We currently trade just below the R14.25 resistance, with the Rand having gained on a weaker USD. The monthly chart shows this to be the top of the bull flag/channel.
Chart 2: Another view (again the monthly chart), shows the potential start of a "right shoulder" of a long term inverse H&S formation.
support and resistance levels from the bank analysts (Investec) this morning confirm these ranges (R1 14.2430, S1 14.15)

免責事項
これらの情報および投稿は、TradingViewが提供または承認する金融、投資、取引、またはその他の種類の助言もしくは推奨であることを意図したものではなく、またこれらに該当するものでもありません。詳細は利用規約をご覧ください。
免責事項
これらの情報および投稿は、TradingViewが提供または承認する金融、投資、取引、またはその他の種類の助言もしくは推奨であることを意図したものではなく、またこれらに該当するものでもありません。詳細は利用規約をご覧ください。