
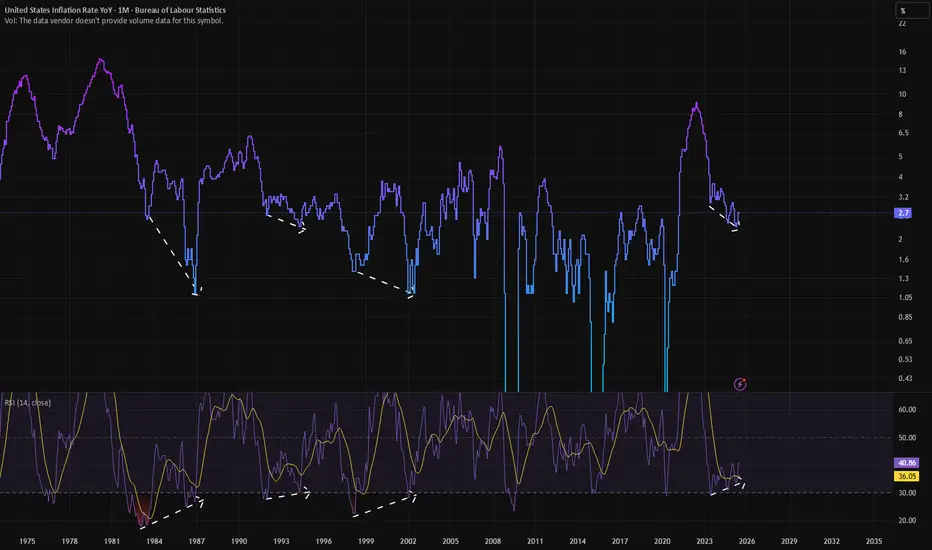
Simple chart.
As you can see, US Inflation has often formed a bullish convergence pattern on it's derived RSI that has been a good predictor of several inflation bottoms.
We have one right now as you can see.
The problem is, that usually, inflation prints this signature when inflation is significantly below targets.
This time, inflation is printing ABOVE targets.
This means if inflation bounces here we can expect another burst of significantly above-target inflation.
Which, logically, means we should not expect rate cuts any time soon.
Either that, or we end up with a weak FED that won't do a U-turn on their rate cut plans, and they cut rates INTO an inflation bounce.
Which is obviously going to be a disaster.
Watch this chart carefully over the next few months going into Q4.
As you can see, US Inflation has often formed a bullish convergence pattern on it's derived RSI that has been a good predictor of several inflation bottoms.
We have one right now as you can see.
The problem is, that usually, inflation prints this signature when inflation is significantly below targets.
This time, inflation is printing ABOVE targets.
This means if inflation bounces here we can expect another burst of significantly above-target inflation.
Which, logically, means we should not expect rate cuts any time soon.
Either that, or we end up with a weak FED that won't do a U-turn on their rate cut plans, and they cut rates INTO an inflation bounce.
Which is obviously going to be a disaster.
Watch this chart carefully over the next few months going into Q4.
トレード稼働中
So I am looking at taking first position.Fundamentally, we had a small bounce that retraced, however, I believe that commodity prices are now the key to this.

免責事項
これらの情報および投稿は、TradingViewが提供または承認する金融、投資、取引、またはその他の種類の助言もしくは推奨であることを意図したものではなく、またこれらに該当するものでもありません。詳細は利用規約をご覧ください。
免責事項
これらの情報および投稿は、TradingViewが提供または承認する金融、投資、取引、またはその他の種類の助言もしくは推奨であることを意図したものではなく、またこれらに該当するものでもありません。詳細は利用規約をご覧ください。