
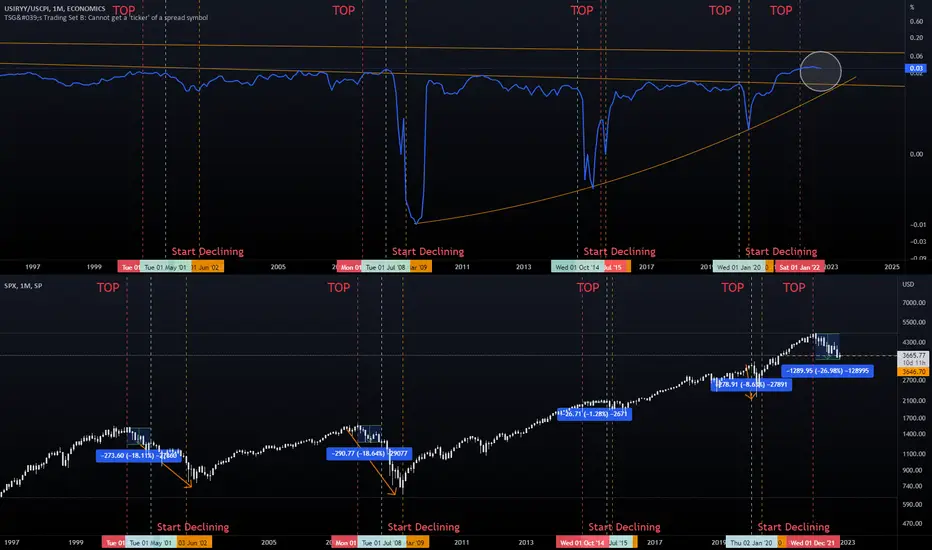
As you can see - all crashes on SPX have been synced with the above chart dipping big time.
What do we have now ? The chart hasn't even gone down - yet SPX has dipped -27%.
The difference between SPX's TOP and the start of declining of Inflation Rate / CPI is of an average 15-18% decline on SPX.
The only problem is that we haven't even started properly declining (circled area).
Two assumptions based on this - Either we still have time in this market and this was just a correction...
or...
... the fall will be huge.
Personally expecting markets to recover a bit and soon inflation rate will spike down together with SPX falling.
Not investing big time before seeing a proper spike down.
Cheers!
What do we have now ? The chart hasn't even gone down - yet SPX has dipped -27%.
The difference between SPX's TOP and the start of declining of Inflation Rate / CPI is of an average 15-18% decline on SPX.
The only problem is that we haven't even started properly declining (circled area).
Two assumptions based on this - Either we still have time in this market and this was just a correction...
or...
... the fall will be huge.
Personally expecting markets to recover a bit and soon inflation rate will spike down together with SPX falling.
Not investing big time before seeing a proper spike down.
Cheers!
ノート
Another observation - From SPX TOP to the Declining we always had 9 months (except on the rushing Covid crash) - From there we need to monitor Inflation to dip and start investing again. We are at 8 months now.

免責事項
これらの情報および投稿は、TradingViewが提供または承認する金融、投資、取引、またはその他の種類の助言もしくは推奨であることを意図したものではなく、またこれらに該当するものでもありません。詳細は利用規約をご覧ください。
免責事項
これらの情報および投稿は、TradingViewが提供または承認する金融、投資、取引、またはその他の種類の助言もしくは推奨であることを意図したものではなく、またこれらに該当するものでもありません。詳細は利用規約をご覧ください。