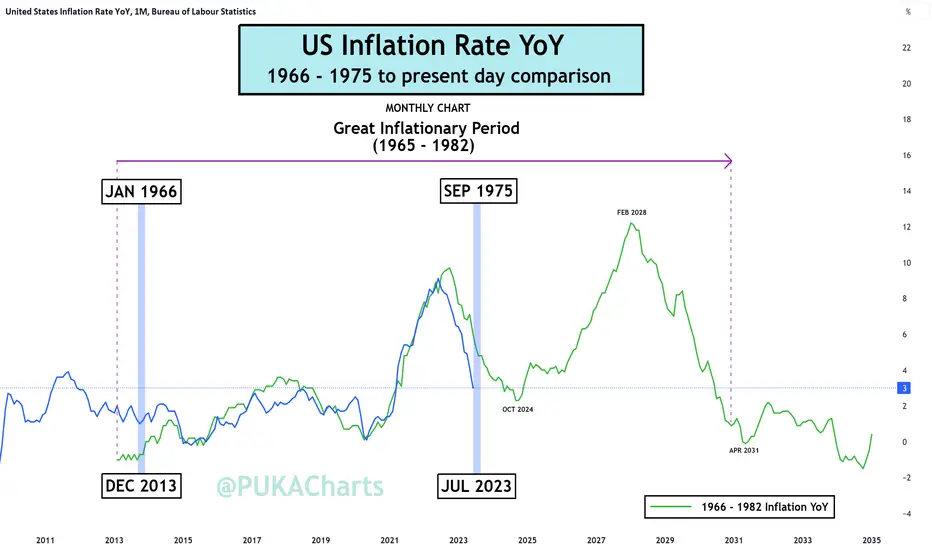
US Inflation Rate YoY Comparison -  USIRYY
Stark similarities to the beginning of the Great Inflationary Period (GIP) which ranged from 1965 - 1982.
The GIP fractal is not a prediction, it only offers us perspective and context. As an example, US Inflation YoY could potentially bounce around between 3 - 4% for another 32 months as it did between 1975 - 1978 before making any major move. This is a scenario I had not considered, an almost 3 year sideways boring consolidation.
We will continue to track this chart to see how it compares moving forward into the future.
PUKA
USIRYYStark similarities to the beginning of the Great Inflationary Period (GIP) which ranged from 1965 - 1982.
The GIP fractal is not a prediction, it only offers us perspective and context. As an example, US Inflation YoY could potentially bounce around between 3 - 4% for another 32 months as it did between 1975 - 1978 before making any major move. This is a scenario I had not considered, an almost 3 year sideways boring consolidation.
We will continue to track this chart to see how it compares moving forward into the future.
PUKA
ノート
Just like my S&P500 comparison chart to the 1966 - 1973 period, this inflation rate comparison over the same period (albeit out to 1982) is demonstrating some very similar moves. Time will tell if the FED are in control here and if a repeat of the 70's will occur or not.

関連の投稿
免責事項
これらの情報および投稿は、TradingViewが提供または承認する金融、投資、取引、またはその他の種類の助言もしくは推奨であることを意図したものではなく、またこれらに該当するものでもありません。詳細は利用規約をご覧ください。
免責事項
これらの情報および投稿は、TradingViewが提供または承認する金融、投資、取引、またはその他の種類の助言もしくは推奨であることを意図したものではなく、またこれらに該当するものでもありません。詳細は利用規約をご覧ください。