
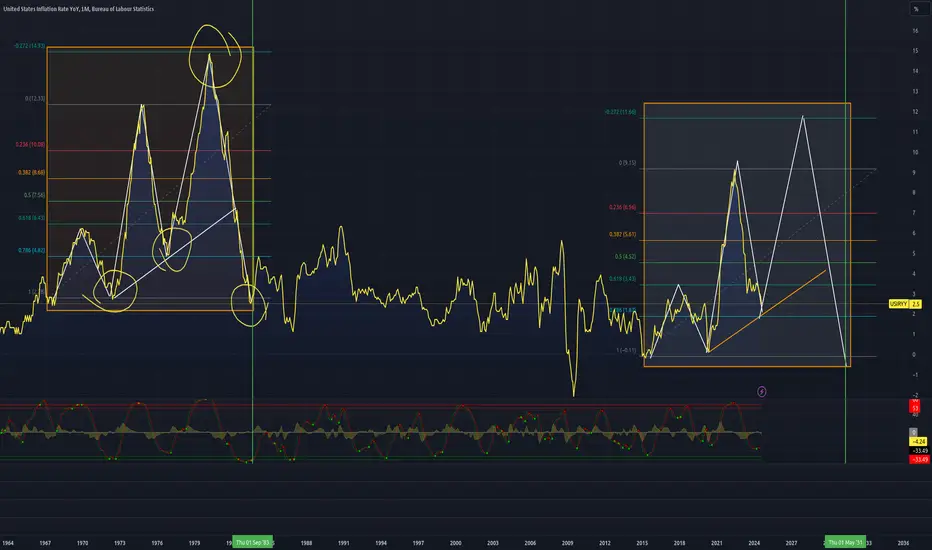
history may not repeat itself, but it rhymes... or so they say. But in this case, so far we have an EXACT repeat, starting in 2015. The chart uses the exactly same angles and duration from the inflation we had in the 1970s. I put this together around 6 months ago and so far... it continues to track.
You be the judge of what's going to happen. Of course, time will tell and we'll see how it all plays out.
You be the judge of what's going to happen. Of course, time will tell and we'll see how it all plays out.

免責事項
これらの情報および投稿は、TradingViewが提供または承認する金融、投資、取引、またはその他の種類の助言もしくは推奨であることを意図したものではなく、またこれらに該当するものでもありません。詳細は利用規約をご覧ください。
免責事項
これらの情報および投稿は、TradingViewが提供または承認する金融、投資、取引、またはその他の種類の助言もしくは推奨であることを意図したものではなく、またこれらに該当するものでもありません。詳細は利用規約をご覧ください。