
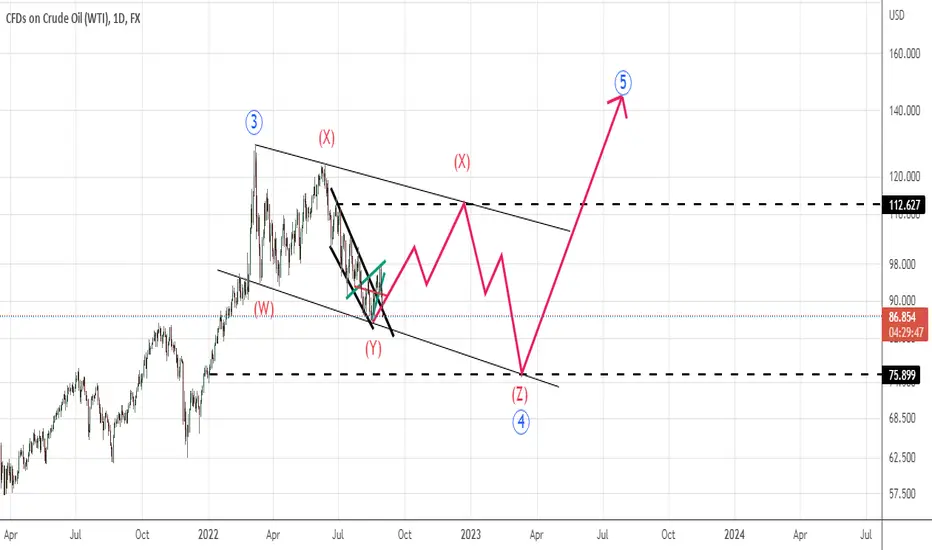
daily time frame wave count is a big picture of usoil wave sturcture as depicted on the chart indicating upward move toward 112-115 $ then going down for 75$ as these two numbers is taken from Kijensen and Tenkensen overlapped target and also our wolfe wave pattern and is in coincidence with USDCAD wave structure as below

if you have any comments about how you think for this analysis please share
thanks
if you have any comments about how you think for this analysis please share
thanks

免責事項
これらの情報および投稿は、TradingViewが提供または承認する金融、投資、取引、またはその他の種類の助言もしくは推奨であることを意図したものではなく、またこれらに該当するものでもありません。詳細は利用規約をご覧ください。
免責事項
これらの情報および投稿は、TradingViewが提供または承認する金融、投資、取引、またはその他の種類の助言もしくは推奨であることを意図したものではなく、またこれらに該当するものでもありません。詳細は利用規約をご覧ください。