
Hi traders,
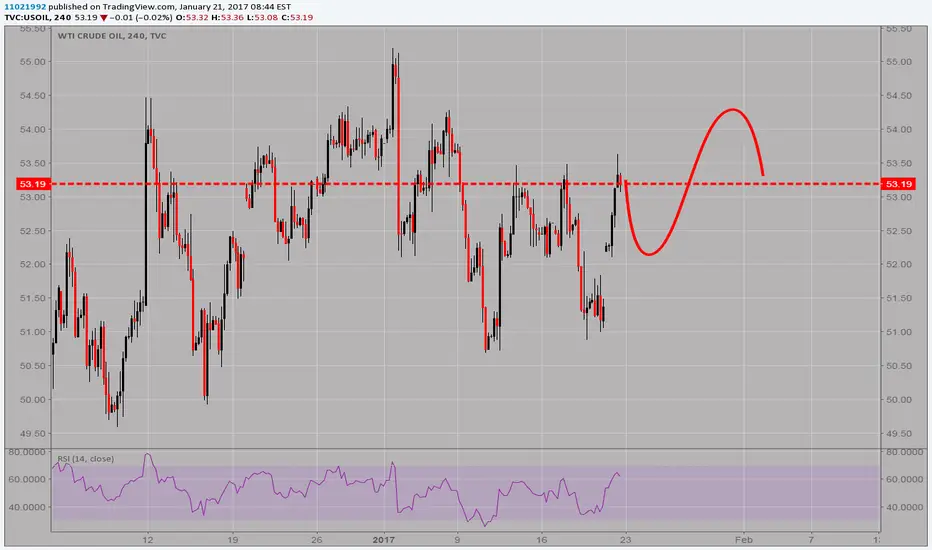
Here we have the USOIL 4H chart. The red line is the expected price movement for this pair.
I think we will start off the week with a correction to the downside. The 52 area has been pretty good support and resistance in the past. After that I expect a breakout to the upside.
Cheers
Here we have the USOIL 4H chart. The red line is the expected price movement for this pair.
I think we will start off the week with a correction to the downside. The 52 area has been pretty good support and resistance in the past. After that I expect a breakout to the upside.
Cheers
ノート
Let's see if we can make a new higher high.
関連の投稿
免責事項
これらの情報および投稿は、TradingViewが提供または承認する金融、投資、取引、またはその他の種類の助言もしくは推奨であることを意図したものではなく、またこれらに該当するものでもありません。詳細は利用規約をご覧ください。
関連の投稿
免責事項
これらの情報および投稿は、TradingViewが提供または承認する金融、投資、取引、またはその他の種類の助言もしくは推奨であることを意図したものではなく、またこれらに該当するものでもありません。詳細は利用規約をご覧ください。