
Monthly chart already Published
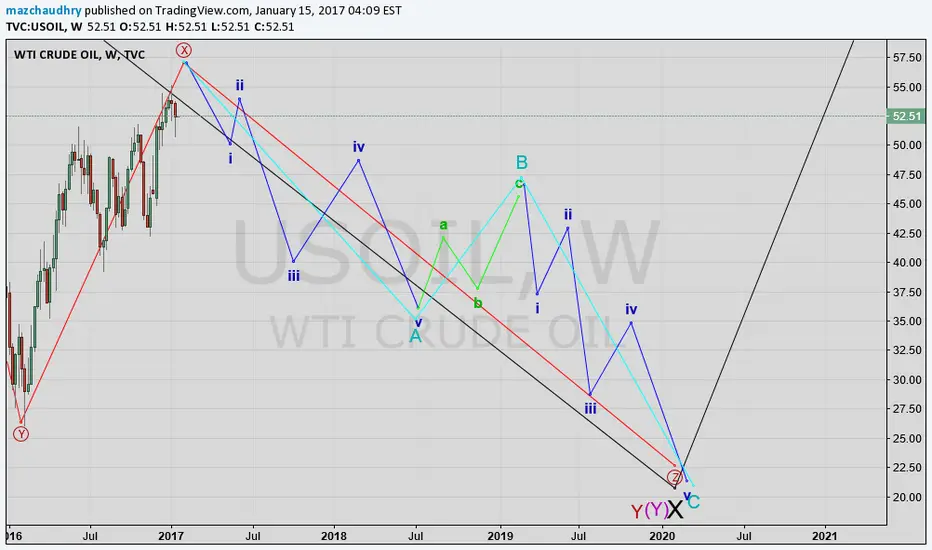
Here is my Weekly chart with Bit more explaining the short wave .
Short From 56.50 till 20.00 will be in ABC Formation ( As it is a Corrective Pattern )
Further division of ABC as bellow :
A= 12345
B= abc
C = 12345
Trade Plan ::
Lets wait for the Completion of X at 56.50
I will wait for (i)of A to complete
(ii) of A will be a Pullback there after a Congestion
I am going to enter into short trade at start of (iii)of A
many happy green pips to you all
Elliot Wave By mazchaudhry
Trade at your own Risk .

関連の投稿
免責事項
これらの情報および投稿は、TradingViewが提供または承認する金融、投資、取引、またはその他の種類の助言もしくは推奨であることを意図したものではなく、またこれらに該当するものでもありません。詳細は利用規約をご覧ください。
免責事項
これらの情報および投稿は、TradingViewが提供または承認する金融、投資、取引、またはその他の種類の助言もしくは推奨であることを意図したものではなく、またこれらに該当するものでもありません。詳細は利用規約をご覧ください。