
There are few indicators that lead to the decision to short Crude Oil.
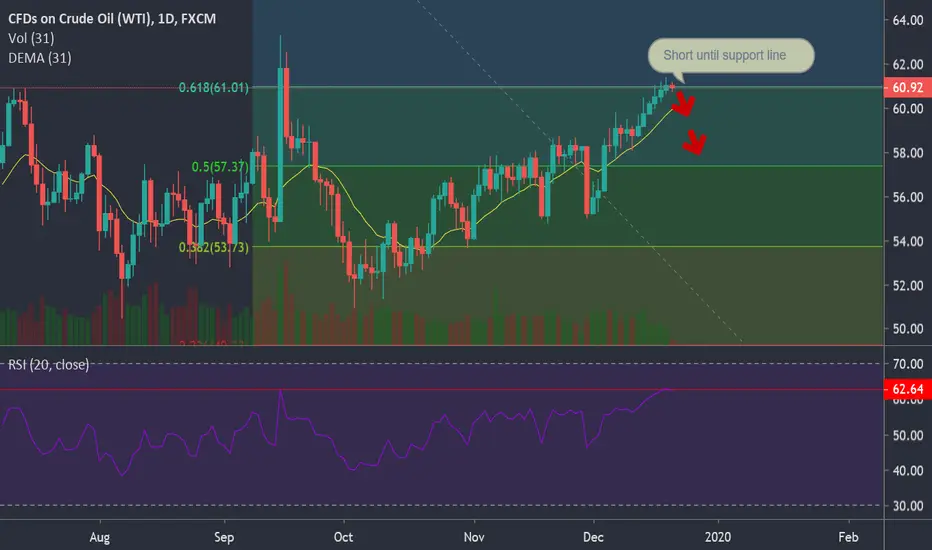
First, the chart has performed an unsuccessful attempt to break the 0.618 Fibonacci retracement, which is also a strong resistance line over the years.
Second, the RSI, as highlighted, is showing exhaustion at 62.64 points. It is also the resistance in the last pull down.
It might be not enough for everyone, but Oil has a tendency to repeat itself, and it does happen before.
According to the above, the decision is to short oil. The next support line seems to be at 58.33 (not displayed in the chart) and after that, the next support is at 57.37, which is 0.5 Fibonacci retracement.
Because it is a short-term trade, I entered to DWT, which is x3 Inverse Crude Oil.
More on our website: iam-unchained.com
First, the chart has performed an unsuccessful attempt to break the 0.618 Fibonacci retracement, which is also a strong resistance line over the years.
Second, the RSI, as highlighted, is showing exhaustion at 62.64 points. It is also the resistance in the last pull down.
It might be not enough for everyone, but Oil has a tendency to repeat itself, and it does happen before.
According to the above, the decision is to short oil. The next support line seems to be at 58.33 (not displayed in the chart) and after that, the next support is at 57.37, which is 0.5 Fibonacci retracement.
Because it is a short-term trade, I entered to DWT, which is x3 Inverse Crude Oil.
More on our website: iam-unchained.com

免責事項
これらの情報および投稿は、TradingViewが提供または承認する金融、投資、取引、またはその他の種類の助言もしくは推奨であることを意図したものではなく、またこれらに該当するものでもありません。詳細は利用規約をご覧ください。
免責事項
これらの情報および投稿は、TradingViewが提供または承認する金融、投資、取引、またはその他の種類の助言もしくは推奨であることを意図したものではなく、またこれらに該当するものでもありません。詳細は利用規約をご覧ください。