
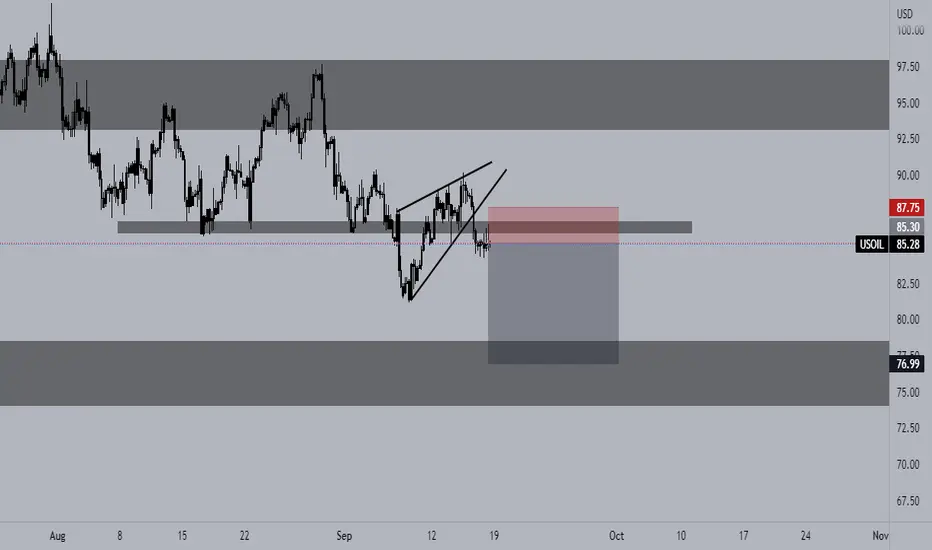
From the W1 timeframe, we can see a double top pattern that successfully broken the neckline confirming bearish pressure. Also, last weeks WI candle closed bearish confirming sell momentum.
On the D1, we can clearly see that price pulled back after what looked like a head and shoulders pattern and after failing to break the neckline slumped back below support. This also indicates strong bearish momentum.
Finally on my entry timeframe the H4, we see the ascending wedge which broke and came back to support to resistance before heading lower.

免責事項
これらの情報および投稿は、TradingViewが提供または承認する金融、投資、取引、またはその他の種類の助言もしくは推奨であることを意図したものではなく、またこれらに該当するものでもありません。詳細は利用規約をご覧ください。
免責事項
これらの情報および投稿は、TradingViewが提供または承認する金融、投資、取引、またはその他の種類の助言もしくは推奨であることを意図したものではなく、またこれらに該当するものでもありません。詳細は利用規約をご覧ください。