
A slightly wild variation to this long term bullish theory on Crude Oil 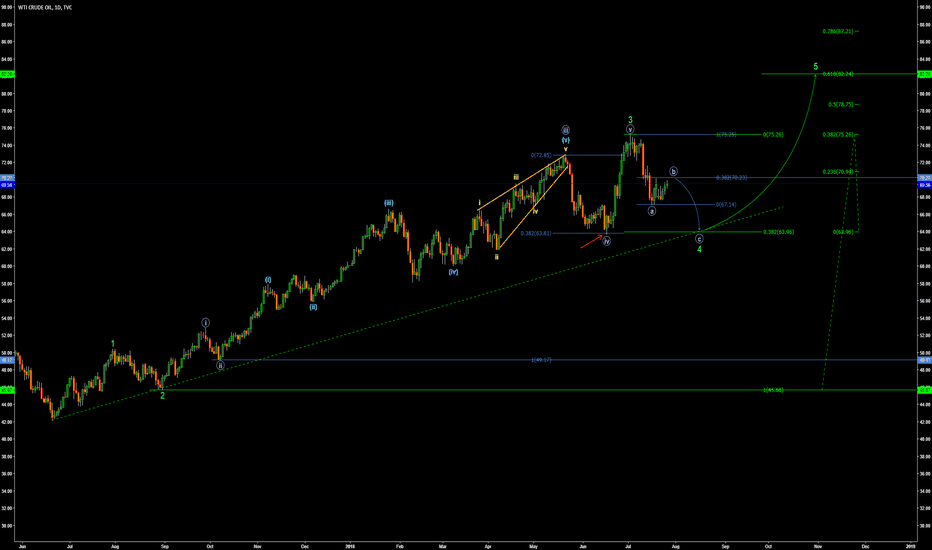
This idea is a bit wild but there are similarities between 2007/08 and 2017/18, explained below in screenshots.
2007/08:
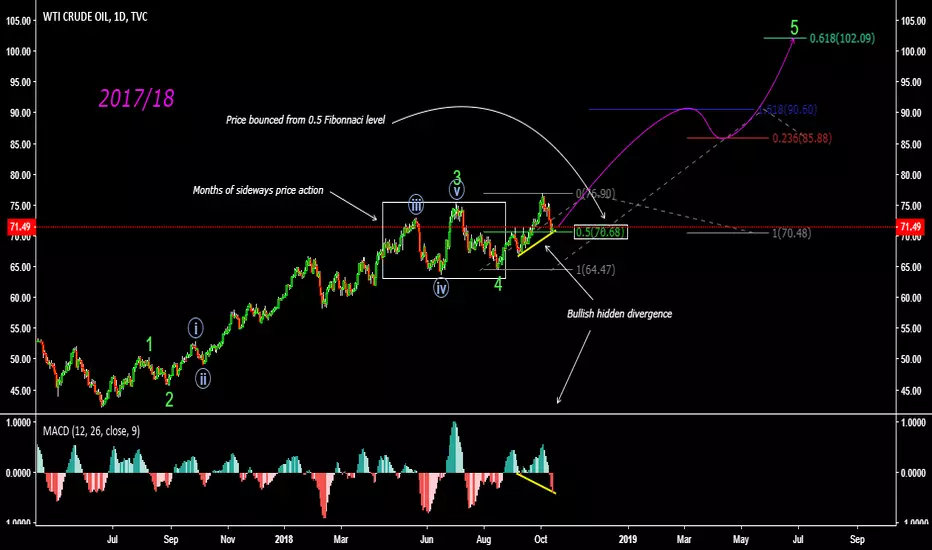
There was 3 months of sideways price action from November 2007 until January 2008, followed by a large rise in price that then corrected to the 0.5 Fibonnaci level. As price fell back there was bullish hidden divergence (MACD histogram made lower low but price made higher low, indicating trend continuation)

2017/18:
Same sideways price action, same large rise following sideways price action, same 0.5 Fibonnaci retracement, same bullish hidden divergence

This idea is a bit wild but there are similarities between 2007/08 and 2017/18, explained below in screenshots.
2007/08:
There was 3 months of sideways price action from November 2007 until January 2008, followed by a large rise in price that then corrected to the 0.5 Fibonnaci level. As price fell back there was bullish hidden divergence (MACD histogram made lower low but price made higher low, indicating trend continuation)
2017/18:
Same sideways price action, same large rise following sideways price action, same 0.5 Fibonnaci retracement, same bullish hidden divergence

免責事項
これらの情報および投稿は、TradingViewが提供または承認する金融、投資、取引、またはその他の種類の助言もしくは推奨であることを意図したものではなく、またこれらに該当するものでもありません。詳細は利用規約をご覧ください。
免責事項
これらの情報および投稿は、TradingViewが提供または承認する金融、投資、取引、またはその他の種類の助言もしくは推奨であることを意図したものではなく、またこれらに該当するものでもありません。詳細は利用規約をご覧ください。