
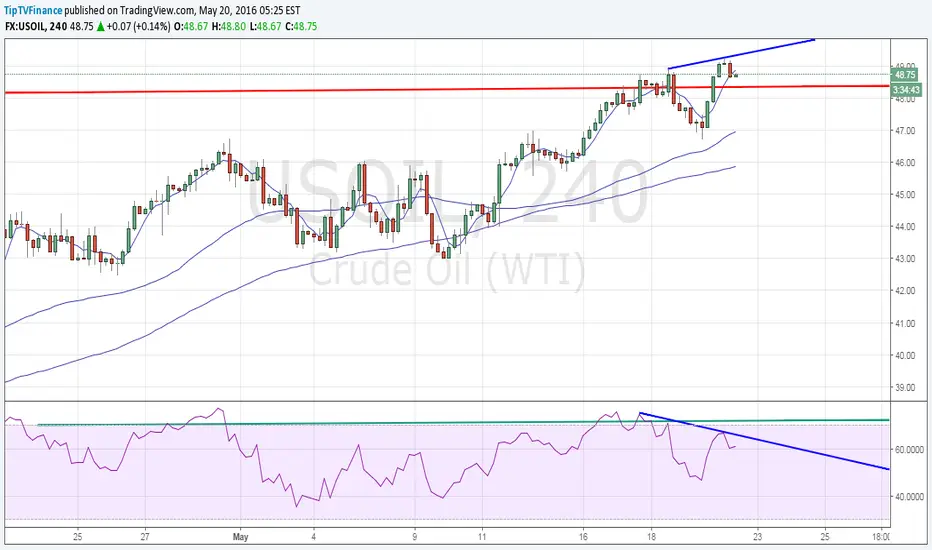
Prices hit a high of $49.14 before trimming gains to trade around $48.80 levels.
- 4-hour chart shows a bearish price RSI divergence.
- Also note, futures show a gap up opening today. The gap is between $48.22 and $48.82 levels.
- In the light of bearish price RSI divergence, prices appear likely to fill the gap ahead of NY closing.
- On a larger scheme of things, bullish invalidation is seen only if prices see a day end closing below Apr 29 high.

関連の投稿
免責事項
これらの情報および投稿は、TradingViewが提供または承認する金融、投資、取引、またはその他の種類の助言もしくは推奨であることを意図したものではなく、またこれらに該当するものでもありません。詳細は利用規約をご覧ください。
関連の投稿
免責事項
これらの情報および投稿は、TradingViewが提供または承認する金融、投資、取引、またはその他の種類の助言もしくは推奨であることを意図したものではなく、またこれらに該当するものでもありません。詳細は利用規約をご覧ください。