
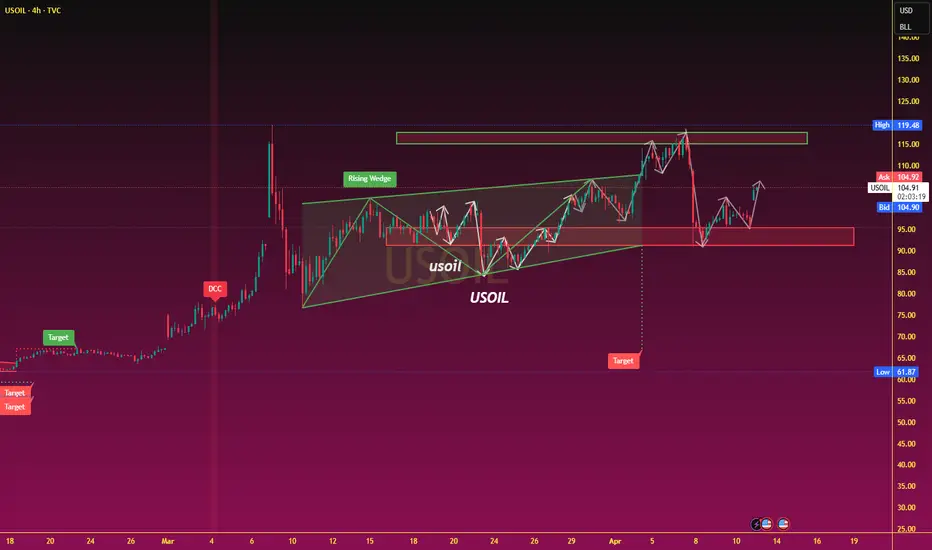
From a technical perspective, the daily chart structure indicates that the market has re-entered a strong upward channel, with bullish momentum showing a marked increase; however, it also signals a certain degree of short-term overbought risk. The low point established during the previous pullback serves as a critical short-term support level; currently, key support is situated near $95. Conversely, overhead resistance is concentrated around the psychological threshold of $112 and the area of previous highs. Should the price achieve a decisive breakout and firmly establish itself above $112, it could open up further upside potential, potentially testing the $119 region. Conversely, if the price surges only to retreat—breaking below $95—it may enter a phase of technical correction to partially fill the existing price gap.
Key Factors: Short-term price movements remain highly contingent upon developments in the geopolitical landscape. Should the conflict continue to escalate, oil prices could advance further and breach key resistance levels; conversely, if signs of de-escalation emerge, oil prices could undergo a sharp correction.
Key Factors: Short-term price movements remain highly contingent upon developments in the geopolitical landscape. Should the conflict continue to escalate, oil prices could advance further and breach key resistance levels; conversely, if signs of de-escalation emerge, oil prices could undergo a sharp correction.

免責事項
これらの情報および投稿は、TradingViewが提供または承認する金融、投資、取引、またはその他の種類の助言もしくは推奨であることを意図したものではなく、またこれらに該当するものでもありません。詳細は利用規約をご覧ください。
免責事項
これらの情報および投稿は、TradingViewが提供または承認する金融、投資、取引、またはその他の種類の助言もしくは推奨であることを意図したものではなく、またこれらに該当するものでもありません。詳細は利用規約をご覧ください。