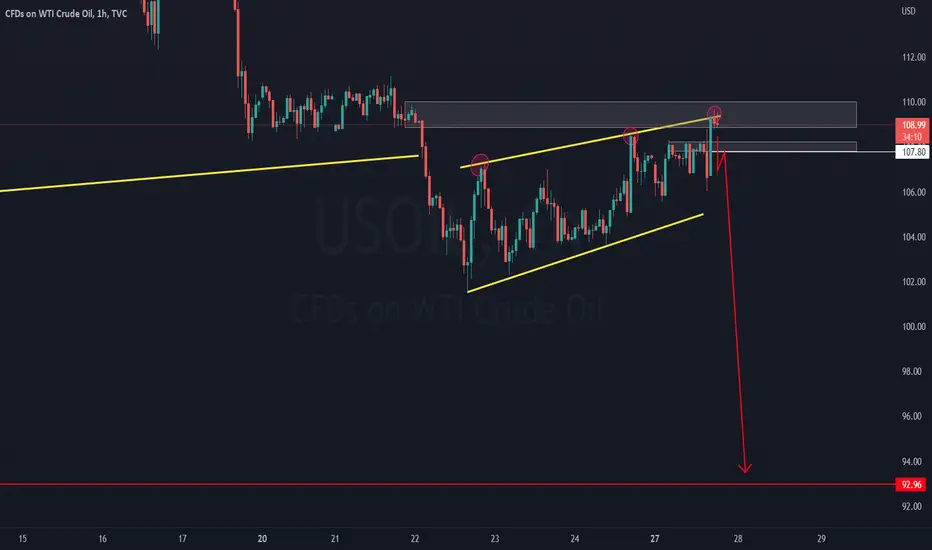
Oil has been riding that trendline to new heights, but the more times a trendline is tested, the weaker it gets.
this theory has held true once more as price has broken below this MAJOR trendline.
A break of structure can also be spotted as price retests previous areas of support as resistance.
It looks like its time to sell as price seems to have completed the wave sequence of a bearish continuation pattern(bearish flag pattern).
CHECK THE LINKED IDEA FOR THE FULL SETUP
 USOIL
USOIL
Happy trading!!
this theory has held true once more as price has broken below this MAJOR trendline.
A break of structure can also be spotted as price retests previous areas of support as resistance.
It looks like its time to sell as price seems to have completed the wave sequence of a bearish continuation pattern(bearish flag pattern).
CHECK THE LINKED IDEA FOR THE FULL SETUP
USOILHappy trading!!

免責事項
これらの情報および投稿は、TradingViewが提供または承認する金融、投資、取引、またはその他の種類の助言もしくは推奨であることを意図したものではなく、またこれらに該当するものでもありません。詳細は利用規約をご覧ください。
免責事項
これらの情報および投稿は、TradingViewが提供または承認する金融、投資、取引、またはその他の種類の助言もしくは推奨であることを意図したものではなく、またこれらに該当するものでもありません。詳細は利用規約をご覧ください。