
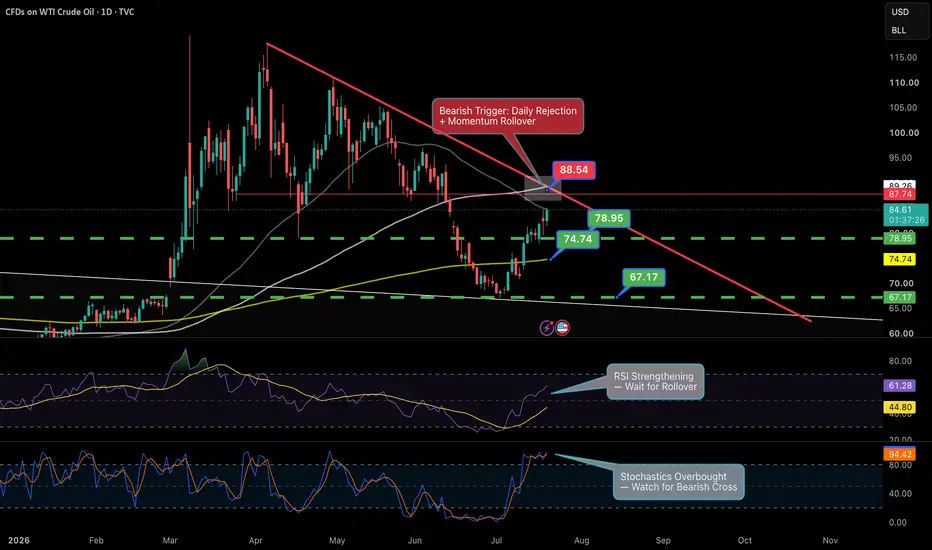
WTI crude oil has staged a strong recovery from the recent low and is now approaching an important daily resistance confluence.
The main decision area sits around $87.74–$89.26, where several technical factors converge:
A long-term descending resistance trendline
Horizontal resistance near $87.74
Major moving-average resistance near $89.26
Momentum is currently still bullish. RSI is strengthening and remains above its moving average, while daily stochastics are deeply overbought. Overbought conditions alone are not a short signal, so I am waiting for evidence that momentum is actually beginning to roll over.
Bearish scenario
The short setup becomes more attractive if WTI reaches the resistance zone and produces:
A clear daily rejection candle
A bearish stochastic cross from overbought territory
RSI turning lower, ideally followed by a cross below its moving average
If those conditions develop, the first downside level is the prior breakout support near $78.95.
A break below that level could lead to the primary pullback objective at the rising 200-day moving average near $74.74. (ETFs SCO and DRIP can be used for daily shorts for example)
If the 200-day moving average fails to hold, the next major structural support is near $67.17.
Key levels
Resistance confluence: $87.74–$89.26
Additional overhead resistance: $92.49
First downside support: $78.95
Primary pullback target: $74.74
Secondary support: $67.17
Invalidation
A sustained daily close above $89.26 would weaken the immediate rejection thesis. A breakout above $92.49 would more clearly favor continued bullish expansion rather than a pullback.
Current status
Wait for confirmation.
WTI is still advancing with strengthening RSI, so entering short before a confirmed rejection would be premature. The preferred setup is a rejection from the resistance confluence accompanied by a measurable momentum rollover.
Educational analysis only—not financial advice.
The main decision area sits around $87.74–$89.26, where several technical factors converge:
A long-term descending resistance trendline
Horizontal resistance near $87.74
Major moving-average resistance near $89.26
Momentum is currently still bullish. RSI is strengthening and remains above its moving average, while daily stochastics are deeply overbought. Overbought conditions alone are not a short signal, so I am waiting for evidence that momentum is actually beginning to roll over.
Bearish scenario
The short setup becomes more attractive if WTI reaches the resistance zone and produces:
A clear daily rejection candle
A bearish stochastic cross from overbought territory
RSI turning lower, ideally followed by a cross below its moving average
If those conditions develop, the first downside level is the prior breakout support near $78.95.
A break below that level could lead to the primary pullback objective at the rising 200-day moving average near $74.74. (ETFs SCO and DRIP can be used for daily shorts for example)
If the 200-day moving average fails to hold, the next major structural support is near $67.17.
Key levels
Resistance confluence: $87.74–$89.26
Additional overhead resistance: $92.49
First downside support: $78.95
Primary pullback target: $74.74
Secondary support: $67.17
Invalidation
A sustained daily close above $89.26 would weaken the immediate rejection thesis. A breakout above $92.49 would more clearly favor continued bullish expansion rather than a pullback.
Current status
Wait for confirmation.
WTI is still advancing with strengthening RSI, so entering short before a confirmed rejection would be premature. The preferred setup is a rejection from the resistance confluence accompanied by a measurable momentum rollover.
Educational analysis only—not financial advice.
トレード稼働中
Price broke above the target this morning. The second buy order is an ascending trendline that was the bottom of that big macro triangle on June 11th. If you follow that up, there is second buy order between $95.25 and $96.25. But keep in mind as the days pass, that target climbs with that trend line. I'll double my position there, but will also hedge my bet and take a long if we see at least two daily candles close above the original target and retest that target for support. トレード終了: 利益確定目標に到達
Closed the trade this morning. Worked out great. Now looking to re-enter short between $86 and $86.90 with a downside target #1 of $79.30
Nexus ChartTools | Clearer Charts. Better Decisions.
Proprietary TradingView indicators for clearer technical analysis.
Creator of S/R + D and MTF Cross.
For invite-only access or support, send me a private message. Not financial advice.
Proprietary TradingView indicators for clearer technical analysis.
Creator of S/R + D and MTF Cross.
For invite-only access or support, send me a private message. Not financial advice.
免責事項
これらの情報および投稿は、TradingViewが提供または承認する金融、投資、取引、またはその他の種類の助言もしくは推奨であることを意図したものではなく、またこれらに該当するものでもありません。詳細は利用規約をご覧ください。
Nexus ChartTools | Clearer Charts. Better Decisions.
Proprietary TradingView indicators for clearer technical analysis.
Creator of S/R + D and MTF Cross.
For invite-only access or support, send me a private message. Not financial advice.
Proprietary TradingView indicators for clearer technical analysis.
Creator of S/R + D and MTF Cross.
For invite-only access or support, send me a private message. Not financial advice.
免責事項
これらの情報および投稿は、TradingViewが提供または承認する金融、投資、取引、またはその他の種類の助言もしくは推奨であることを意図したものではなく、またこれらに該当するものでもありません。詳細は利用規約をご覧ください。