
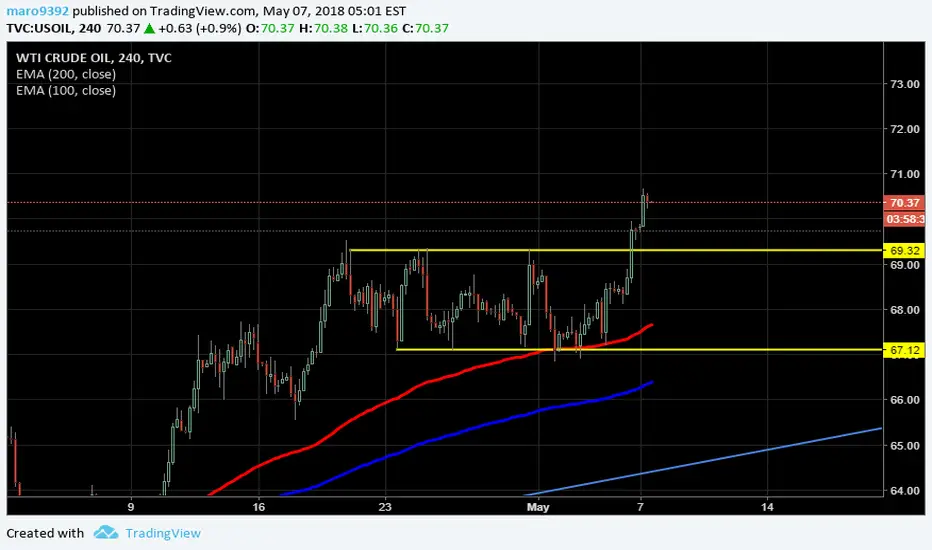
Hello traders! Today i want to show you USOIL in 4h timeframe , during the previous weeks the price moved inside a rectangle , a pattern that might indicate a continuation of the trend , in this case an uptrend or an inversion trend. EMA 100 acted as support and the price broke the rectangle and now is looking for another upside leg. We will monitor the area around 70 usd , to find some long position. Have a nice day traders!
ノート
in 4h timeframe broke the resistance but in daily timeframe hasn't been able to break it. Now is going higher , over previous highs , it might reach 80 usd area? We will see手動でトレードを終了しました

免責事項
これらの情報および投稿は、TradingViewが提供または承認する金融、投資、取引、またはその他の種類の助言もしくは推奨であることを意図したものではなく、またこれらに該当するものでもありません。詳細は利用規約をご覧ください。
免責事項
これらの情報および投稿は、TradingViewが提供または承認する金融、投資、取引、またはその他の種類の助言もしくは推奨であることを意図したものではなく、またこれらに該当するものでもありません。詳細は利用規約をご覧ください。