
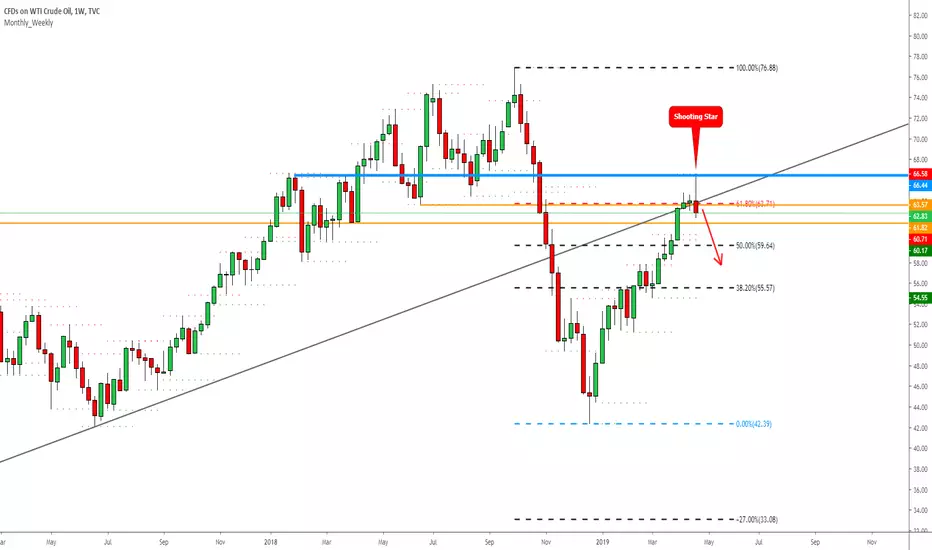
Last week, we got a really strong rejection from the higher levels which ended up with a bearish candlestick pattern!
The rejection came (trade criteria):
1. From the Fibonacci golden ratio of 62%
2. From the previously worked resistance level (blue line)
3. From the previously worked support levels which now becomes resistance (orange lines)
4. From the ABC Equal waves, drawn from the bottom
5. From the trendline which is pulled from 2016 low, second touch 2017 low, it made a breakthrough at 2018 and now, this is a classical retest situation. The 2018 breakthrough has occurred with a strong and powerful candle so this could be a sign that this trendline works as a strong resistance!
6. From the Monthly EMA100 & soon also 200 EMA
7. Rejection area consists of 6 monthly high or low levels!
8. Possibly, we have a first stronger lower low during on the rally from the bottom:

9(!!). AND this rejection ended up with Shooting Star (sloppy bearish Engulfing, so, 2in1 ;P) candlestick pattern on the Weekly timeframe.
Setup is like a textbook example, let's see, what the market want's to offer us!
Feel free to support my idea post by hitting the "LIKE" button, it is my only fee from You!
Have a nice weekend,
Cheers!
*This information is not a recommendation to buy or sell, it is used for educational purposes only!
The rejection came (trade criteria):
1. From the Fibonacci golden ratio of 62%
2. From the previously worked resistance level (blue line)
3. From the previously worked support levels which now becomes resistance (orange lines)
4. From the ABC Equal waves, drawn from the bottom
5. From the trendline which is pulled from 2016 low, second touch 2017 low, it made a breakthrough at 2018 and now, this is a classical retest situation. The 2018 breakthrough has occurred with a strong and powerful candle so this could be a sign that this trendline works as a strong resistance!
6. From the Monthly EMA100 & soon also 200 EMA
7. Rejection area consists of 6 monthly high or low levels!
8. Possibly, we have a first stronger lower low during on the rally from the bottom:
9(!!). AND this rejection ended up with Shooting Star (sloppy bearish Engulfing, so, 2in1 ;P) candlestick pattern on the Weekly timeframe.
Setup is like a textbook example, let's see, what the market want's to offer us!
Feel free to support my idea post by hitting the "LIKE" button, it is my only fee from You!
Have a nice weekend,
Cheers!
*This information is not a recommendation to buy or sell, it is used for educational purposes only!
ノート
2018 down movement starts also with Shooting Star:I don't want to hype, but the last week Shooting Star is even stronger because this closed as a red candle! Red means that sellers dominated the week, which is great considering the next weeks!
ノート
Our "textbook" example works pretty nicely!トレード終了: 利益確定目標に到達
Really sweet!
免責事項
これらの情報および投稿は、TradingViewが提供または承認する金融、投資、取引、またはその他の種類の助言もしくは推奨であることを意図したものではなく、またこれらに該当するものでもありません。詳細は利用規約をご覧ください。
免責事項
これらの情報および投稿は、TradingViewが提供または承認する金融、投資、取引、またはその他の種類の助言もしくは推奨であることを意図したものではなく、またこれらに該当するものでもありません。詳細は利用規約をご覧ください。