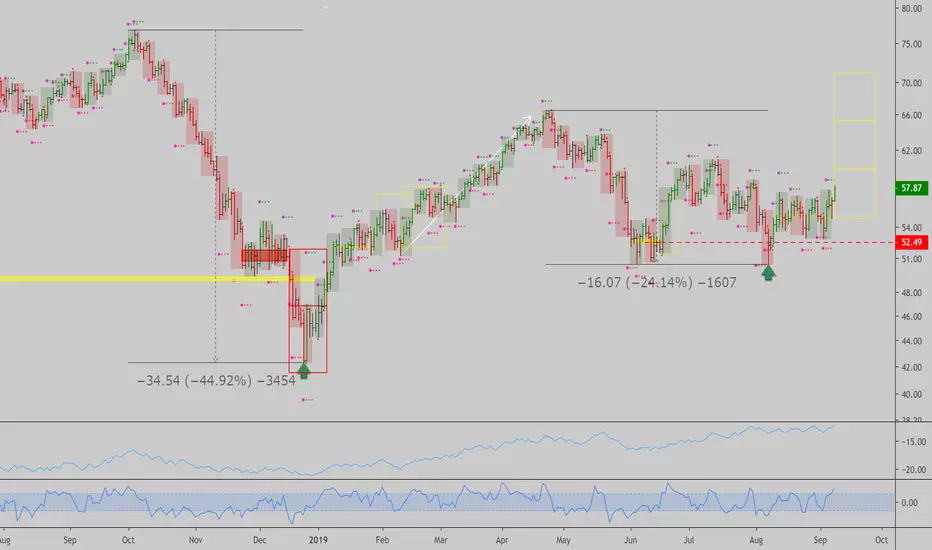
Interesting setup in  USOIL, the fall from the last top favored a bull run in stocks with a 6 month lag, as per timwest's findings suggest (every time oil falls 25-30% it boosts earnings going forward). Monthly charts show accumulation supporting the market below, and daily confirms a trend by today's close. I think stocks are headed higher with oil here as well.
My bias is bullish in energy, oil, chip maker stocks, renewable energy related stocks, and the overall S&P500 index between now and the end of 2020 possibly. Let's see how it goes...Short term stop for oil is below last Friday's low, and short term targets are shown by the yellow boxes on chart.
Cheers,
Ivan Labrie.
USOIL, the fall from the last top favored a bull run in stocks with a 6 month lag, as per timwest's findings suggest (every time oil falls 25-30% it boosts earnings going forward). Monthly charts show accumulation supporting the market below, and daily confirms a trend by today's close. I think stocks are headed higher with oil here as well.My bias is bullish in energy, oil, chip maker stocks, renewable energy related stocks, and the overall S&P500 index between now and the end of 2020 possibly. Let's see how it goes...Short term stop for oil is below last Friday's low, and short term targets are shown by the yellow boxes on chart.
Cheers,
Ivan Labrie.
ノート
トレード終了: ストップロスに到達
トレード稼働中
ノート
Last entry is in profit: If it holds up from here oil can trend higher.
トレード稼働中
Good time to revisit this market on the long side.
Stop @ 52.49
ノート
On track: 手動でトレードを終了しました
Sold in profit here for now, last: 55.95ノート
Timemode trend signals in #oil show the market is sideways. I graphed the directional moves in green or red depending on direction, and the 'energy dissipation' after a move reaches target or the time duration for the move expires in yellow. You can see how a sideways market behaves, it consolidates and trends in bursts, but stays range bound.The white bars are my guess/forecast based on monthly bars, so far we had a rather similar pattern in it.

Public, timestamped track record. Free month of the desk: ivanlabrie.netlify.app
関連の投稿
免責事項
これらの情報および投稿は、TradingViewが提供または承認する金融、投資、取引、またはその他の種類の助言もしくは推奨であることを意図したものではなく、またこれらに該当するものでもありません。詳細は利用規約をご覧ください。
Public, timestamped track record. Free month of the desk: ivanlabrie.netlify.app
関連の投稿
免責事項
これらの情報および投稿は、TradingViewが提供または承認する金融、投資、取引、またはその他の種類の助言もしくは推奨であることを意図したものではなく、またこれらに該当するものでもありません。詳細は利用規約をご覧ください。