
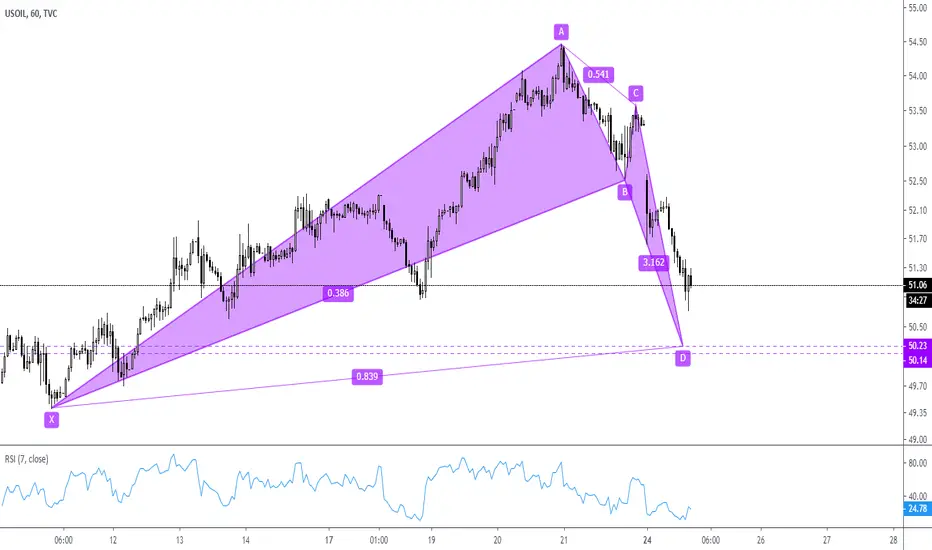
A bullish bat pattern is almost complete in one hour chart, it provides a potential reversal level from 50.230 to 50.140. In the larger time frames, the market is in down-trend, so this buying opportunity is a counter-trend trade. Because the potential reversal level is near the daily chart low point (~50), so I can mark a beautiful stop loss level easily. I will wait for the confirmation signals to show up near the potential reversal level, then decide should I long this market. Please be careful about risk management, especially you are doing a counter-trend trade.
Please follow me if you want to know my trade ideas!
Please follow me if you want to know my trade ideas!

関連の投稿
免責事項
これらの情報および投稿は、TradingViewが提供または承認する金融、投資、取引、またはその他の種類の助言もしくは推奨であることを意図したものではなく、またこれらに該当するものでもありません。詳細は利用規約をご覧ください。
関連の投稿
免責事項
これらの情報および投稿は、TradingViewが提供または承認する金融、投資、取引、またはその他の種類の助言もしくは推奨であることを意図したものではなく、またこれらに該当するものでもありません。詳細は利用規約をご覧ください。