
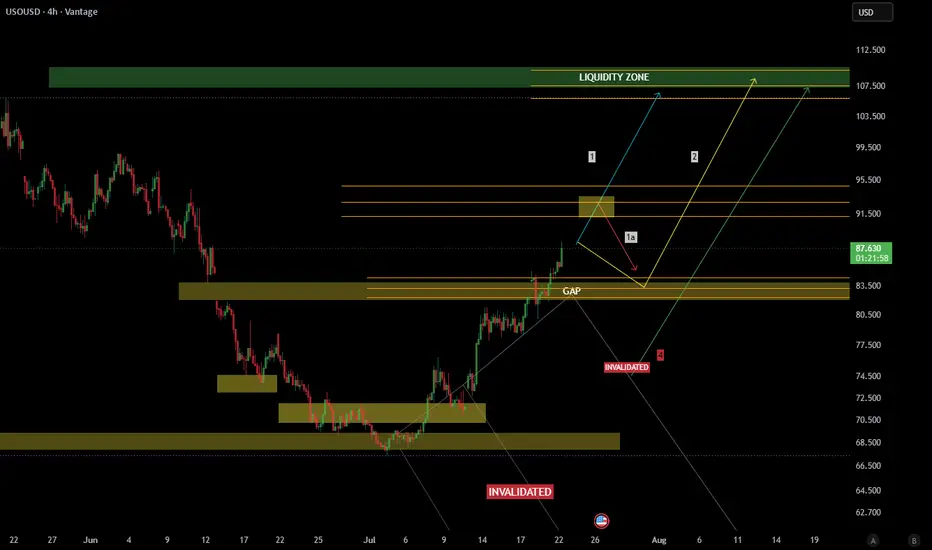
Our previous Path 4 has now been invalidated after price reclaimed the major GAP around 83-84, shifting the short-term structure back to the upside.
The reclaim of this area changes the outlook considerably, but price is now approaching the first significant resistance between 91.5 and 93, where the next decision is likely to take place.
From here I see three possible paths.
Path 1
Price reaches the 91.5-93 supply, reacts lower, and retraces into the GAP before attempting another move toward the higher liquidity zone around 107-109.
Path 1a
Instead of rejecting immediately, price briefly trades above the first supply, sweeps liquidity, then retraces back into the GAP before continuing higher. This would be a classic liquidity grab before expansion.
Path 2
Price retraces directly from current levels into the GAP, finds demand, and then resumes the move toward the higher-timeframe liquidity zone.
The previous bearish scenario remains on the chart for transparency, but it is no longer valid after the reclaim of the GAP and the change in market structure.
As always, these are scenarios rather than predictions. I simply map the areas where I expect liquidity to be taken and let price reveal which path it chooses.
Like, Follow, Boost, Join. Thank You!
Financial Disclaimer:
This post is not financial advice. I am not your financial advisor, your life coach, or your legally responsible adult.
Always do your own research and never trade based solely on internet comedy
The reclaim of this area changes the outlook considerably, but price is now approaching the first significant resistance between 91.5 and 93, where the next decision is likely to take place.
From here I see three possible paths.
Path 1
Price reaches the 91.5-93 supply, reacts lower, and retraces into the GAP before attempting another move toward the higher liquidity zone around 107-109.
Path 1a
Instead of rejecting immediately, price briefly trades above the first supply, sweeps liquidity, then retraces back into the GAP before continuing higher. This would be a classic liquidity grab before expansion.
Path 2
Price retraces directly from current levels into the GAP, finds demand, and then resumes the move toward the higher-timeframe liquidity zone.
The previous bearish scenario remains on the chart for transparency, but it is no longer valid after the reclaim of the GAP and the change in market structure.
As always, these are scenarios rather than predictions. I simply map the areas where I expect liquidity to be taken and let price reveal which path it chooses.
Like, Follow, Boost, Join. Thank You!
Financial Disclaimer:
This post is not financial advice. I am not your financial advisor, your life coach, or your legally responsible adult.
Always do your own research and never trade based solely on internet comedy
トレード稼働中
Press the "play" on the idea image...it was indead Path 4, with a bit of a twist.トレード終了: 利益確定目標に到達
Reached our target up there, BUT, after reviewing the chart, the Liquidity is still there to be swept....
関連の投稿
免責事項
これらの情報および投稿は、TradingViewが提供または承認する金融、投資、取引、またはその他の種類の助言もしくは推奨であることを意図したものではなく、またこれらに該当するものでもありません。詳細は利用規約をご覧ください。
免責事項
これらの情報および投稿は、TradingViewが提供または承認する金融、投資、取引、またはその他の種類の助言もしくは推奨であることを意図したものではなく、またこれらに該当するものでもありません。詳細は利用規約をご覧ください。