
Hello,
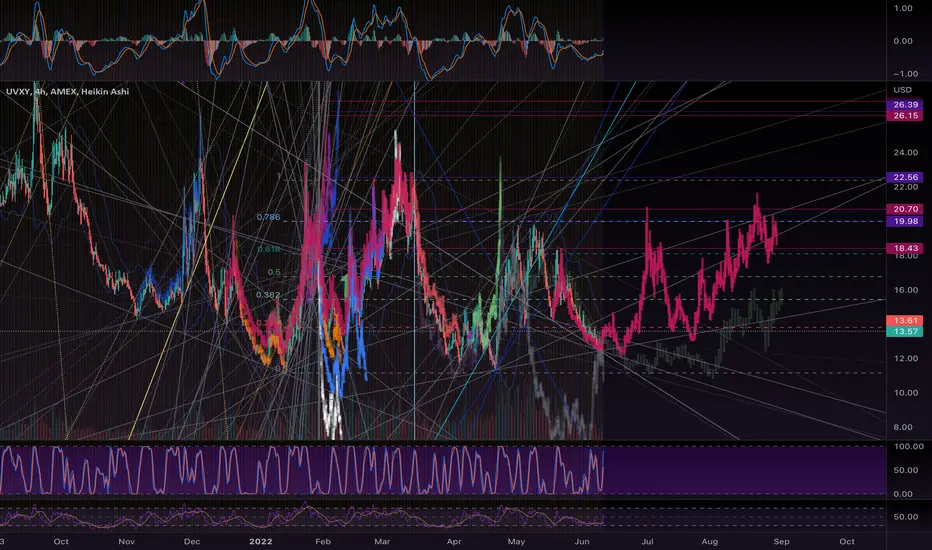
This pink trace is a nice spacial match for the vix, and it correlates with a nice match on the ES1 (SP500). Ill post a screen shot of that below.
Here’s what is interesting to me… this pink trace came from a position of lower lows… and we just printed a higher low… hmmm. That seems up for volatility of it holds.
Also…. The section of horizontal projections, breaking small support layer Jan 5th is my match for the ES1… but the pattern it just did has way higher magnitude within its level. Looks like 3 M shaped monsters flying horizontal… any how… it may be prudent to amplify the vertical scale of the projection in order to match that recent level amplitude.
Follow me.
Good Luck, God Speed, Love & Light to All!
This pink trace is a nice spacial match for the vix, and it correlates with a nice match on the ES1 (SP500). Ill post a screen shot of that below.
Here’s what is interesting to me… this pink trace came from a position of lower lows… and we just printed a higher low… hmmm. That seems up for volatility of it holds.
Also…. The section of horizontal projections, breaking small support layer Jan 5th is my match for the ES1… but the pattern it just did has way higher magnitude within its level. Looks like 3 M shaped monsters flying horizontal… any how… it may be prudent to amplify the vertical scale of the projection in order to match that recent level amplitude.
Follow me.
Good Luck, God Speed, Love & Light to All!
ノート
ノート
Exciting… had to stretch the amplitude of the pink forecast to match the recent moves…. The blue measure is the previous fit, and now the pink! That quite a bit of expansion in volatility! This could get a bit exponential from here too… Current fit is prioritizing the segment between the arrows.
ノート
Oops… repositioned the blue measure 
免責事項
これらの情報および投稿は、TradingViewが提供または承認する金融、投資、取引、またはその他の種類の助言もしくは推奨であることを意図したものではなく、またこれらに該当するものでもありません。詳細は利用規約をご覧ください。
免責事項
これらの情報および投稿は、TradingViewが提供または承認する金融、投資、取引、またはその他の種類の助言もしくは推奨であることを意図したものではなく、またこれらに該当するものでもありません。詳細は利用規約をご覧ください。