
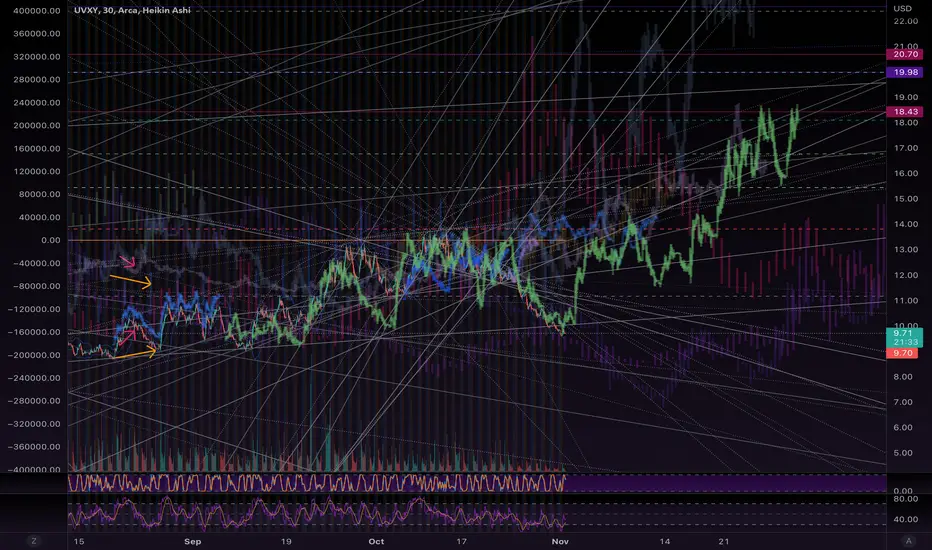
This is how the next level collapse would look in the UVXY Volatilty derivative. The SP500 is pretty much inverse of this.
Each movement propagates and grows as the crashes become increasingly volatile, as the historic inflationary levels of the entire market begin to collapse.
Good Luck, God Speed, Love & Light to all!
Each movement propagates and grows as the crashes become increasingly volatile, as the historic inflationary levels of the entire market begin to collapse.
Good Luck, God Speed, Love & Light to all!
ノート
Here is a long range view of the ES1 futures version of the SP500. It includes the overnight trading sessions in Europe and Asia, making for much more complete analysis data. We are in the beginning of the bright white trace… You should be able to cycle the (hide drawings) while viewing ideas, like this one.Follow along if you want to know when we add to these ideas :)

免責事項
これらの情報および投稿は、TradingViewが提供または承認する金融、投資、取引、またはその他の種類の助言もしくは推奨であることを意図したものではなく、またこれらに該当するものでもありません。詳細は利用規約をご覧ください。
免責事項
これらの情報および投稿は、TradingViewが提供または承認する金融、投資、取引、またはその他の種類の助言もしくは推奨であることを意図したものではなく、またこれらに該当するものでもありません。詳細は利用規約をご覧ください。