
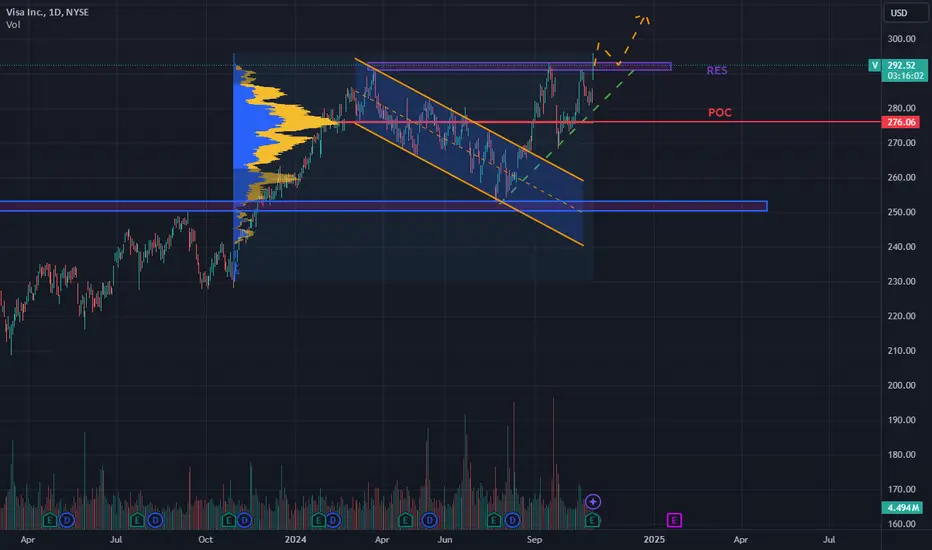
Visa's stock (V) shows a clear long-term uptrend.
Following a decline in 2022, it regained its 2021 highs in early 2024, breaking through resistance and continuing its upward trend.

The stock reached new highs around the $290 area, then retraced, forming a bullish flag pattern, down to a support area near $250.

Currently, it is testing the highs again in the $290 area, reached via a gap up after positive earnings and revenue announcements. If it confirms a breakout above resistance, with a potential retest, the stock could continue its bullish trend.

Following a decline in 2022, it regained its 2021 highs in early 2024, breaking through resistance and continuing its upward trend.
The stock reached new highs around the $290 area, then retraced, forming a bullish flag pattern, down to a support area near $250.
Currently, it is testing the highs again in the $290 area, reached via a gap up after positive earnings and revenue announcements. If it confirms a breakout above resistance, with a potential retest, the stock could continue its bullish trend.

免責事項
これらの情報および投稿は、TradingViewが提供または承認する金融、投資、取引、またはその他の種類の助言もしくは推奨であることを意図したものではなく、またこれらに該当するものでもありません。詳細は利用規約をご覧ください。
免責事項
これらの情報および投稿は、TradingViewが提供または承認する金融、投資、取引、またはその他の種類の助言もしくは推奨であることを意図したものではなく、またこれらに該当するものでもありません。詳細は利用規約をご覧ください。