アップデート済
VAL - Sora Validator Token
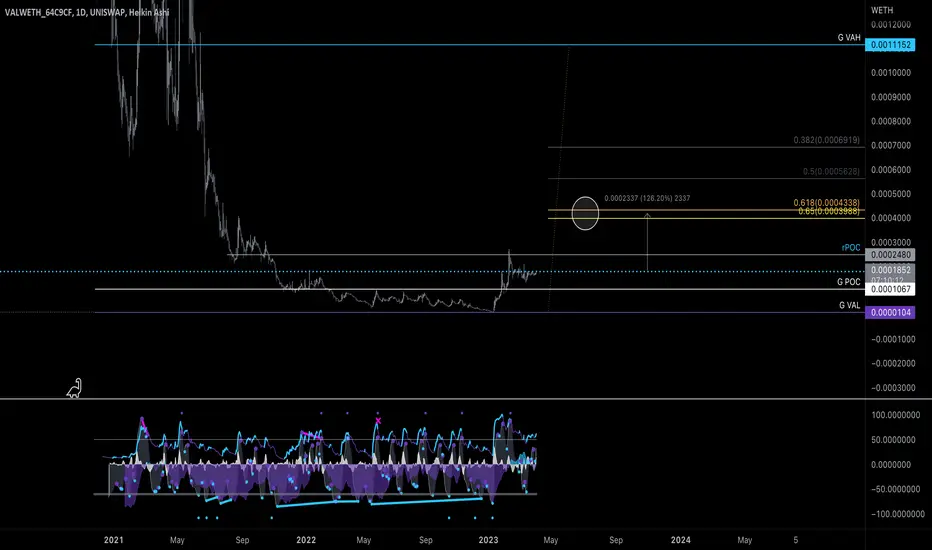
This chart is a creative venture. I did something a little different. I pulled a volume profile for the entire uniswap history of VAL token. I then pulled a FIB range on that revealed VAH and VAL area (value area high, low).
It is creative in the sense that I want to see if the total buying and selling data from the volume profile will be respected in the future with external market conditions. It all plays together but so do the minor details.
So it's a bit predictive in nature but no guarantees, and no fortune telling.
I will make other charts on VAL but for now I will start here.
It is creative in the sense that I want to see if the total buying and selling data from the volume profile will be respected in the future with external market conditions. It all plays together but so do the minor details.
So it's a bit predictive in nature but no guarantees, and no fortune telling.
I will make other charts on VAL but for now I will start here.
ノート
High Confluence Below us as well ノート
Almost there
***Get 25% off Nami indicators - nami-trading.com/?dt_id=1375915
***CRYPTO TAXES use KOINLY - koinly.io/?via=97548A41&utm_source=affiliate
***JOIN TRADINGVIEW tradingview.com/?aff_id=137
***CRYPTO TAXES use KOINLY - koinly.io/?via=97548A41&utm_source=affiliate
***JOIN TRADINGVIEW tradingview.com/?aff_id=137
免責事項
これらの情報および投稿は、TradingViewが提供または承認する金融、投資、取引、またはその他の種類の助言もしくは推奨であることを意図したものではなく、またこれらに該当するものでもありません。詳細は利用規約をご覧ください。
***Get 25% off Nami indicators - nami-trading.com/?dt_id=1375915
***CRYPTO TAXES use KOINLY - koinly.io/?via=97548A41&utm_source=affiliate
***JOIN TRADINGVIEW tradingview.com/?aff_id=137
***CRYPTO TAXES use KOINLY - koinly.io/?via=97548A41&utm_source=affiliate
***JOIN TRADINGVIEW tradingview.com/?aff_id=137
免責事項
これらの情報および投稿は、TradingViewが提供または承認する金融、投資、取引、またはその他の種類の助言もしくは推奨であることを意図したものではなく、またこれらに該当するものでもありません。詳細は利用規約をご覧ください。