
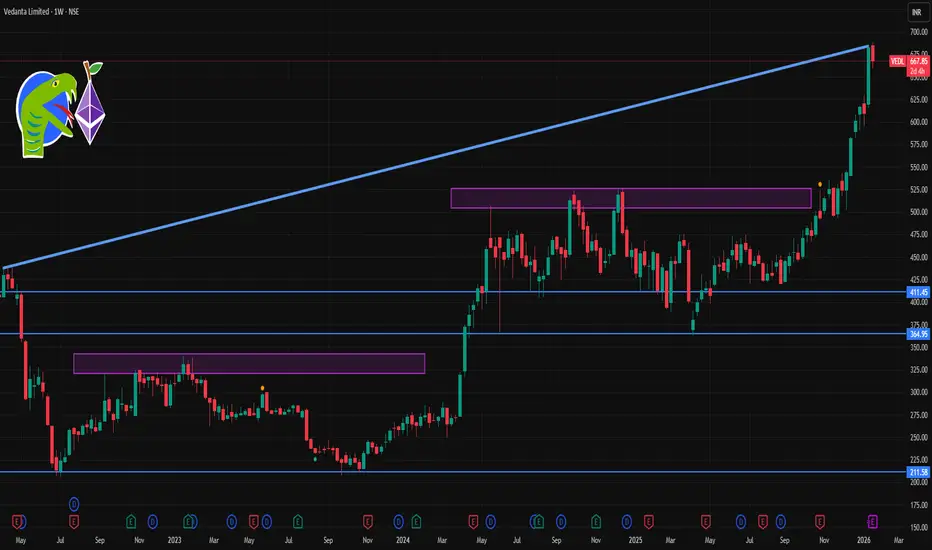
📊 Current Price Context (approximate latest)
• Vedanta is trading around ₹660‑₹675 range on NSE as of the latest session.
📈 Weekly Resistance Levels
These are levels where the stock might face selling pressure on an upward move:
Resistance Zones
1. ₹682–₹688 area – near recent intraday highs and 52‑week high cluster.
2. ~₹693–₹700 – broader higher resistance in week ahead.
3. Above ₹700 – extended breakout zone if bullish momentum accelerates.
👉 Bullish breakout triggers shorter‑term targets toward these zones, especially if sustained above daily pivots/resistance.
📉 Weekly Support Levels
These are areas where price might find buyers or pullback cushions:
Support Zones
1. ~₹665–₹658 – immediate weekly support cluster.
2. ~₹647–₹648 – next meaningful support if the price weakens.
3. ~₹620–₹630 – deeper pivot/demand zone from recent action (from broader short‑term analysis).
4. ~₹560–₹570 – more distant support if the stock corrects further from current levels.
👉 A break below ₹658–665 on weekly closes could shift bias toward deeper support ranges.
🔁 1‑Week Bias Summary
Scenario Level to Watch What It Implies
Bullish continuation Above ₹682–₹688 Can target ₹693–₹700+
Neutral / congestion ₹665–₹658 Choppy range, sideways trades
Bearish correction Below ₹658 Deeper support at ₹620–₹570+

Contact Knowledgehub for a detailed consultation: Dm on WhatsApp: [wa.link/a2o0kz]-
Phone No: [+91 93102 26243]-
Email: [tradingviewknowledgehub@gmail.com]---
-- Let’s achieve success together!
Phone No: [+91 93102 26243]-
Email: [tradingviewknowledgehub@gmail.com]---
-- Let’s achieve success together!
関連の投稿
免責事項
これらの情報および投稿は、TradingViewが提供または承認する金融、投資、取引、またはその他の種類の助言もしくは推奨であることを意図したものではなく、またこれらに該当するものでもありません。詳細は利用規約をご覧ください。