
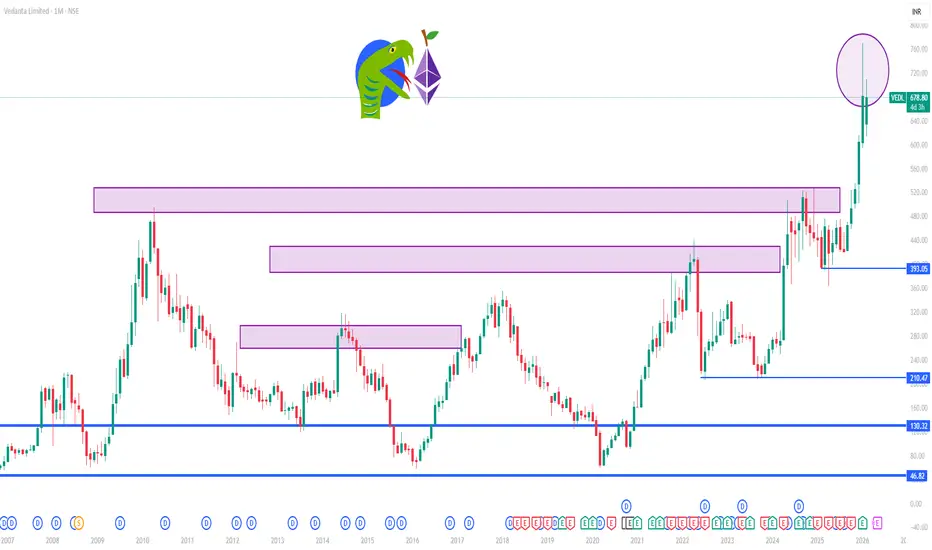
📌 Current Market Price (approx): Around ₹678–₹682 per share on the National Stock Exchange (NSE) of India.
📊 1-Month Timeframe – Key Levels to Watch
🛑 Resistance (Upside)
These are levels where the stock may face selling pressure or struggle to break above:
₹686–₹690 — near immediate technical resistance / upper pivot confluence.
₹695–₹700 — broader higher resistance zone in the near term.
Above ₹700 — extended breakout area if buyers stay strong.
Interpretation: The ₹686–₹690 zone is a key barrier in the 1-month view — a daily close above it could signal further upside toward the ₹695-₹700+ area.
🔽 Support (Downside)
Levels that may act as demand floors if the price corrects:
₹675–₹676 — immediate pivot support near recent swing lows/averages.
₹668–₹670 — secondary support area within the short-term range.
₹655–₹660 — deeper short-term demand zone if fall accelerates.
Interpretation: Holding the ₹675–₹670 zone maintains bullish structure for the month. A break below ₹665–₹660 increases pullback pressure toward lower supports.
📉 Intraday to Weekly Reference (for very short-term traders)
Some pivot studies also point to support levels around ₹675.5, ₹668.6, and resistance near ₹683.6–₹686.4 on shorter frames.
📊 What This Means for the Next Few Weeks
✔️ Bullish scenario:
A daily close above ~₹686–₹690 suggests continuation of the short-term uptrend with targets toward ₹695–₹700+.
⚠️ Neutral/Range-bound:
If price oscillates between ₹675 and ₹690, expect sideways action in the short term.
📉 Bearish risk:
A close below ₹668–₹665 could trigger deeper corrective moves toward ₹655–₹650+ support.
📌 Important Reminder
These technical levels are based on recent price action and technical pivot/average computations — they do not constitute financial advice. Always combine with your risk management and fundamental context before trading.
📊 1-Month Timeframe – Key Levels to Watch
🛑 Resistance (Upside)
These are levels where the stock may face selling pressure or struggle to break above:
₹686–₹690 — near immediate technical resistance / upper pivot confluence.
₹695–₹700 — broader higher resistance zone in the near term.
Above ₹700 — extended breakout area if buyers stay strong.
Interpretation: The ₹686–₹690 zone is a key barrier in the 1-month view — a daily close above it could signal further upside toward the ₹695-₹700+ area.
🔽 Support (Downside)
Levels that may act as demand floors if the price corrects:
₹675–₹676 — immediate pivot support near recent swing lows/averages.
₹668–₹670 — secondary support area within the short-term range.
₹655–₹660 — deeper short-term demand zone if fall accelerates.
Interpretation: Holding the ₹675–₹670 zone maintains bullish structure for the month. A break below ₹665–₹660 increases pullback pressure toward lower supports.
📉 Intraday to Weekly Reference (for very short-term traders)
Some pivot studies also point to support levels around ₹675.5, ₹668.6, and resistance near ₹683.6–₹686.4 on shorter frames.
📊 What This Means for the Next Few Weeks
✔️ Bullish scenario:
A daily close above ~₹686–₹690 suggests continuation of the short-term uptrend with targets toward ₹695–₹700+.
⚠️ Neutral/Range-bound:
If price oscillates between ₹675 and ₹690, expect sideways action in the short term.
📉 Bearish risk:
A close below ₹668–₹665 could trigger deeper corrective moves toward ₹655–₹650+ support.
📌 Important Reminder
These technical levels are based on recent price action and technical pivot/average computations — they do not constitute financial advice. Always combine with your risk management and fundamental context before trading.

Contact Knowledgehub for a detailed consultation: Dm on WhatsApp: [wa.link/a2o0kz]-
Phone No: [+91 93102 26243]-
Email: [tradingviewknowledgehub@gmail.com]---
-- Let’s achieve success together!
Phone No: [+91 93102 26243]-
Email: [tradingviewknowledgehub@gmail.com]---
-- Let’s achieve success together!
関連の投稿
免責事項
これらの情報および投稿は、TradingViewが提供または承認する金融、投資、取引、またはその他の種類の助言もしくは推奨であることを意図したものではなく、またこれらに該当するものでもありません。詳細は利用規約をご覧ください。
Contact Knowledgehub for a detailed consultation: Dm on WhatsApp: [wa.link/a2o0kz]-
Phone No: [+91 93102 26243]-
Email: [tradingviewknowledgehub@gmail.com]---
-- Let’s achieve success together!
Phone No: [+91 93102 26243]-
Email: [tradingviewknowledgehub@gmail.com]---
-- Let’s achieve success together!
関連の投稿
免責事項
これらの情報および投稿は、TradingViewが提供または承認する金融、投資、取引、またはその他の種類の助言もしくは推奨であることを意図したものではなく、またこれらに該当するものでもありません。詳細は利用規約をご覧ください。