
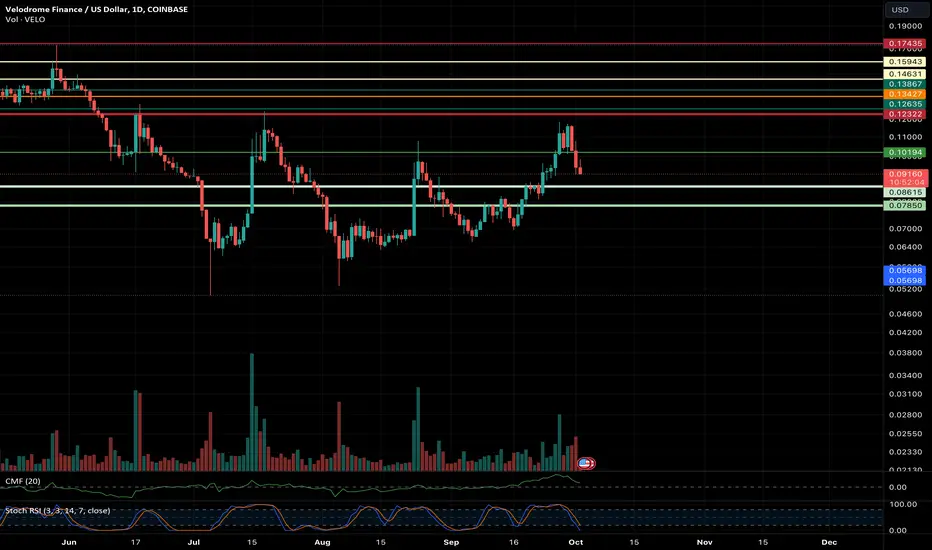
Key Support Zone Analysis for VELO
1. Historical Price Levels: Support zones are often identified by looking at historical price levels where the asset has previously found buying interest. VELO has previously bounced back from the $0.087 to $0.078 range, this could be a significant support zone.
2. Volume Analysis: High trading volume at these levels in the past can indicate strong support. There was significant trading activity around $0.087 to $0.078, it suggests that many traders see this as a buying opportunity.
3. Technical Indicators: Indicators like the Relative Strength Index (RSI) or Moving Averages can help confirm the strength of the support zone. For instance, if the RSI is approaching oversold levels as VELO nears this support zone, it could indicate a potential bounce.
### Conclusion
As VELO approaches the $0.087 to $0.078 support zone, watch for increased volume, positive technical indicators, and favorable market sentiment to confirm the support. If these factors align, it could be a good buying opportunity.
1. Historical Price Levels: Support zones are often identified by looking at historical price levels where the asset has previously found buying interest. VELO has previously bounced back from the $0.087 to $0.078 range, this could be a significant support zone.
2. Volume Analysis: High trading volume at these levels in the past can indicate strong support. There was significant trading activity around $0.087 to $0.078, it suggests that many traders see this as a buying opportunity.
3. Technical Indicators: Indicators like the Relative Strength Index (RSI) or Moving Averages can help confirm the strength of the support zone. For instance, if the RSI is approaching oversold levels as VELO nears this support zone, it could indicate a potential bounce.
### Conclusion
As VELO approaches the $0.087 to $0.078 support zone, watch for increased volume, positive technical indicators, and favorable market sentiment to confirm the support. If these factors align, it could be a good buying opportunity.

免責事項
これらの情報および投稿は、TradingViewが提供または承認する金融、投資、取引、またはその他の種類の助言もしくは推奨であることを意図したものではなく、またこれらに該当するものでもありません。詳細は利用規約をご覧ください。
免責事項
これらの情報および投稿は、TradingViewが提供または承認する金融、投資、取引、またはその他の種類の助言もしくは推奨であることを意図したものではなく、またこれらに該当するものでもありません。詳細は利用規約をご覧ください。