V-ID Token Chart Update
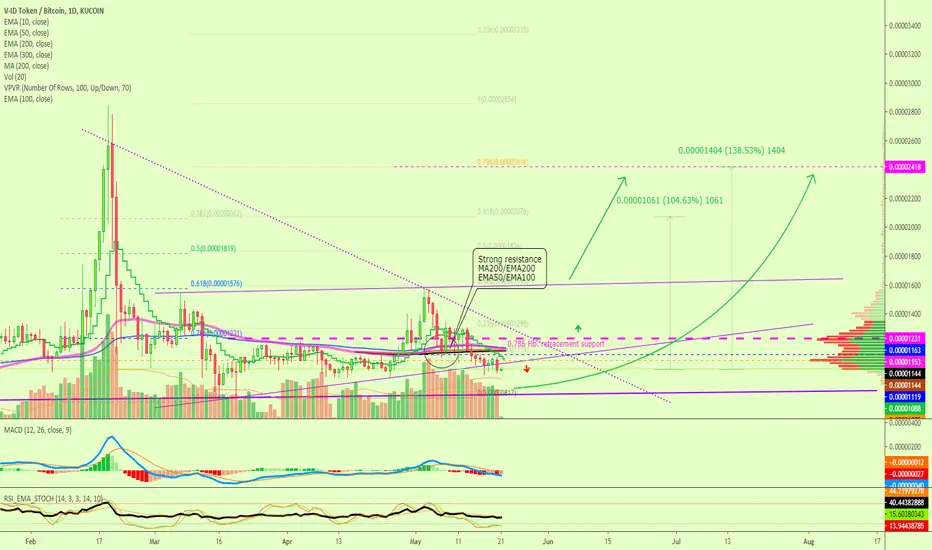
Here we have the same chart we looked at in the past for V-ID Token (VIDTBTC), the path remains the same.
Now that support has been broken, MA200/EMA200, EMA50/EMA100, we can call this same level resistance.
Now that prices moved below the resistance, we follow the second green arrow.
We expect additional mixed-consolidation until prices finally start to increase and jump back up.
We only switch from bullish to bearish if prices drop below the last low.
This is not financial advice.
Thanks a lot for your continued support.
Namaste.

💯 Trading signals (results)
— Late 2026👇
t.me/masteranandatrades/9279
🔥 10-25X Leverage
—Trade-numbers:
t.me/masteranandatrades/9271
✅ PREMIUM &Content
—One-Time Payment
t.me/lamatrades/4 (🔝 since 2017)
— Late 2026👇
t.me/masteranandatrades/9279
🔥 10-25X Leverage
—Trade-numbers:
t.me/masteranandatrades/9271
✅ PREMIUM &Content
—One-Time Payment
t.me/lamatrades/4 (🔝 since 2017)
免責事項
これらの情報および投稿は、TradingViewが提供または承認する金融、投資、取引、またはその他の種類の助言もしくは推奨であることを意図したものではなく、またこれらに該当するものでもありません。詳細は利用規約をご覧ください。