
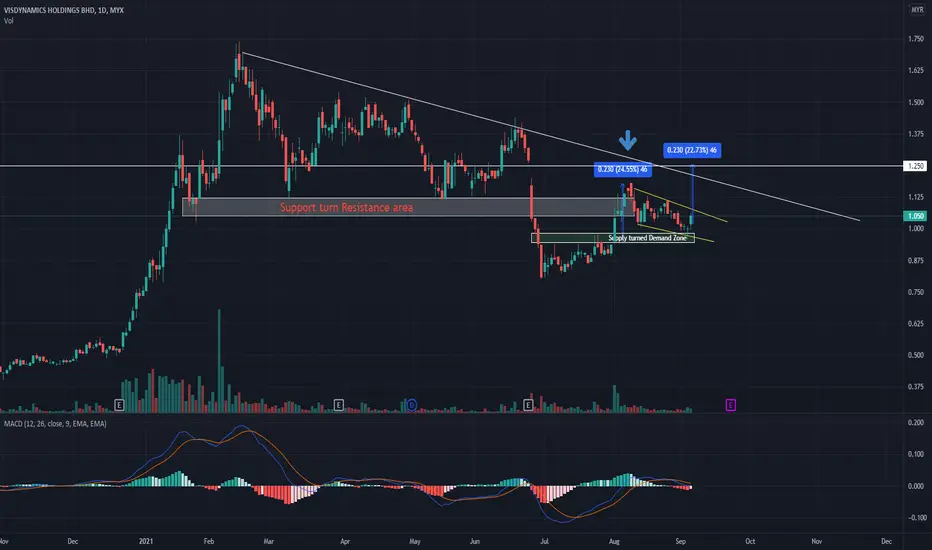
1. Price broke out of resistance area at beginning of August (blue arrow). Normal to see pullback after that.
2. Nice pennant pattern with doji bottom, which it hit a demand zone based on 1H chart. (Should have entered yesterday but too bad...didn't see this)
3. Forecast about 0.25 move, which happens to meet horizontal + trendline resistance.
Disclaimer: I'm not giving any trading and investing advice. I'm just sharing my chart observations.
If you have any symbols that you'd like me to analyze, feel free to drop me a comment.
2. Nice pennant pattern with doji bottom, which it hit a demand zone based on 1H chart. (Should have entered yesterday but too bad...didn't see this)
3. Forecast about 0.25 move, which happens to meet horizontal + trendline resistance.
Disclaimer: I'm not giving any trading and investing advice. I'm just sharing my chart observations.
If you have any symbols that you'd like me to analyze, feel free to drop me a comment.
トレード終了: 利益確定目標に到達
nice trade!
免責事項
これらの情報および投稿は、TradingViewが提供または承認する金融、投資、取引、またはその他の種類の助言もしくは推奨であることを意図したものではなく、またこれらに該当するものでもありません。詳細は利用規約をご覧ください。
免責事項
これらの情報および投稿は、TradingViewが提供または承認する金融、投資、取引、またはその他の種類の助言もしくは推奨であることを意図したものではなく、またこれらに該当するものでもありません。詳細は利用規約をご覧ください。