
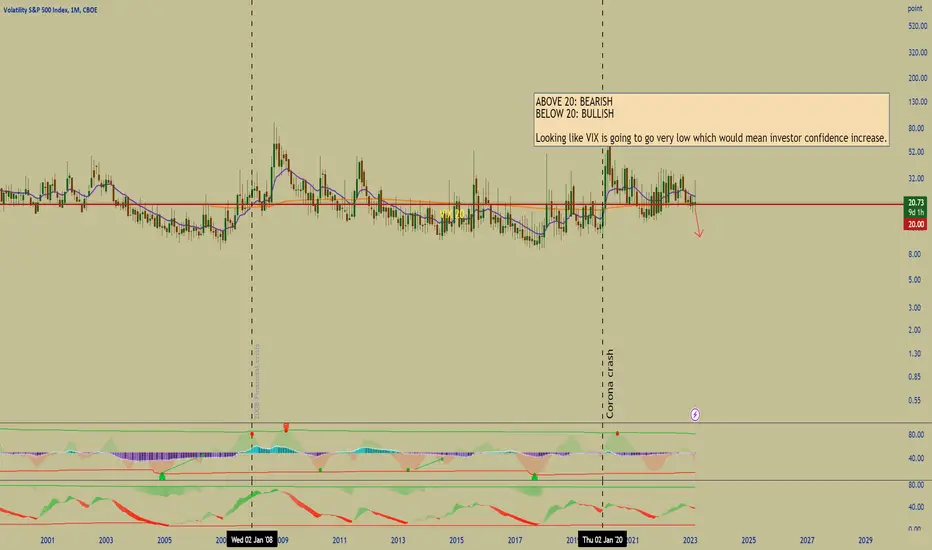
VIX showing signals of a bullish market open
1)I believe something will big will happen to the market in the upcoming days as the VIX is almost reaching a new All time Low possibly indicating a bullish shift in the market.
2) In the second chart shown, it seems like the VIX will enter a free fall.
How to translate the VIX: Above 20 we are bearish and below 20 we are bullish. The VIX indicator is a representation of investor fear in the market. As the fear grows, the number increases making it bad for the market overall.
Why should we care?
-This indicator has successfully predicted the 2008 crash and Corona crash. It is a very powerful indicator when it comes to knowing how investors feel psychologically about the market.
1)I believe something will big will happen to the market in the upcoming days as the VIX is almost reaching a new All time Low possibly indicating a bullish shift in the market.
2) In the second chart shown, it seems like the VIX will enter a free fall.
How to translate the VIX: Above 20 we are bearish and below 20 we are bullish. The VIX indicator is a representation of investor fear in the market. As the fear grows, the number increases making it bad for the market overall.
Why should we care?
-This indicator has successfully predicted the 2008 crash and Corona crash. It is a very powerful indicator when it comes to knowing how investors feel psychologically about the market.

免責事項
これらの情報および投稿は、TradingViewが提供または承認する金融、投資、取引、またはその他の種類の助言もしくは推奨であることを意図したものではなく、またこれらに該当するものでもありません。詳細は利用規約をご覧ください。
免責事項
これらの情報および投稿は、TradingViewが提供または承認する金融、投資、取引、またはその他の種類の助言もしくは推奨であることを意図したものではなく、またこれらに該当するものでもありません。詳細は利用規約をご覧ください。