
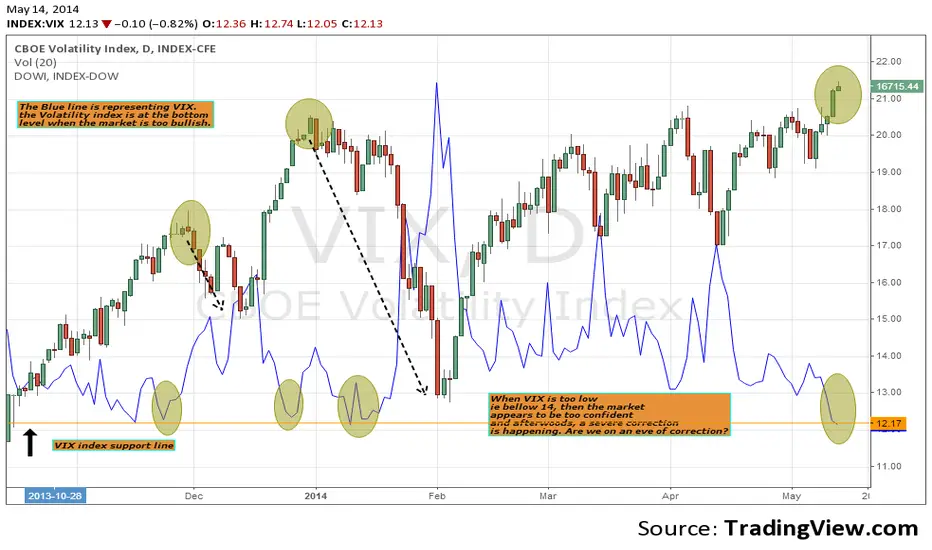
When we do add DOWI and VIX charts one on the other, we can clearly see the correlation between the two indexes.
When the market is too BULL, VIX is at a very low level. VIX level is too low, and shows an overconfidence of the market. Immediatly a correction, that can be severe in deed is following. Putting a side the technical indicators, we may be able to anticipate a correction. Of course this chart doesn't show the level of correction, but at least, an idea of the timing of it and the short term trend
When the market is too BULL, VIX is at a very low level. VIX level is too low, and shows an overconfidence of the market. Immediatly a correction, that can be severe in deed is following. Putting a side the technical indicators, we may be able to anticipate a correction. Of course this chart doesn't show the level of correction, but at least, an idea of the timing of it and the short term trend

免責事項
これらの情報および投稿は、TradingViewが提供または承認する金融、投資、取引、またはその他の種類の助言もしくは推奨であることを意図したものではなく、またこれらに該当するものでもありません。詳細は利用規約をご覧ください。
免責事項
これらの情報および投稿は、TradingViewが提供または承認する金融、投資、取引、またはその他の種類の助言もしくは推奨であることを意図したものではなく、またこれらに該当するものでもありません。詳細は利用規約をご覧ください。