
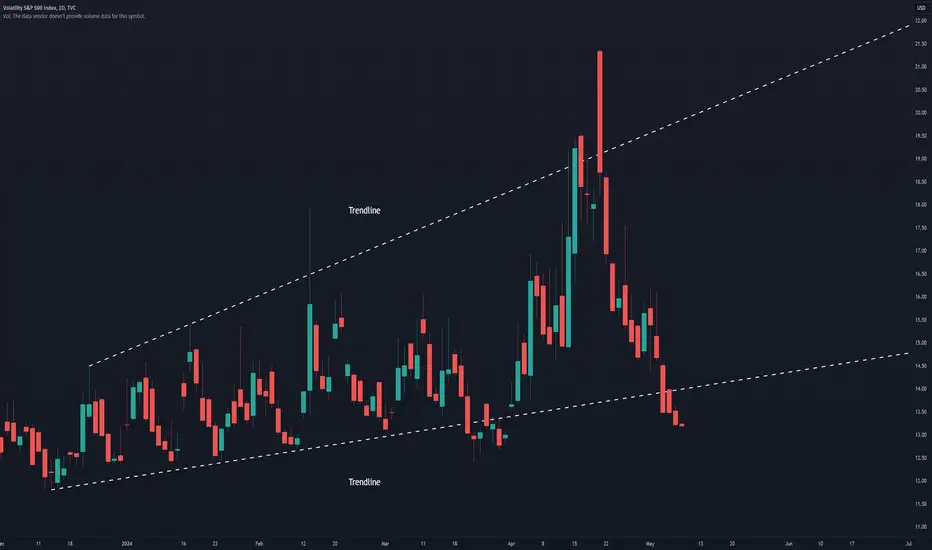
With economists celebrating the "goldilocks economy" and VIX breaking below the lower bound of the pattern, the big question lingers: "Is this another fakeout before resurgence to $20?"
Illustration 1.01

The yellow arrow indicates a breakout below the lower bound of the pattern we have been observing since its early formation.
Please feel free to express your ideas and thoughts in the comment section.
DISCLAIMER: This analysis is not intended to encourage any buying or selling of any particular securities. Furthermore, it should not be a basis for taking any trade action by an individual investor or any other entity. Therefore, your own due diligence is highly advised before entering a trade.
Illustration 1.01
The yellow arrow indicates a breakout below the lower bound of the pattern we have been observing since its early formation.
Please feel free to express your ideas and thoughts in the comment section.
DISCLAIMER: This analysis is not intended to encourage any buying or selling of any particular securities. Furthermore, it should not be a basis for taking any trade action by an individual investor or any other entity. Therefore, your own due diligence is highly advised before entering a trade.
ノート
Illustration 1.02VIX formed an opening gap today.
ノート
The opening gap was filled, which is positive for the market.
関連の投稿
免責事項
これらの情報および投稿は、TradingViewが提供または承認する金融、投資、取引、またはその他の種類の助言もしくは推奨であることを意図したものではなく、またこれらに該当するものでもありません。詳細は利用規約をご覧ください。
関連の投稿
免責事項
これらの情報および投稿は、TradingViewが提供または承認する金融、投資、取引、またはその他の種類の助言もしくは推奨であることを意図したものではなく、またこれらに該当するものでもありません。詳細は利用規約をご覧ください。