
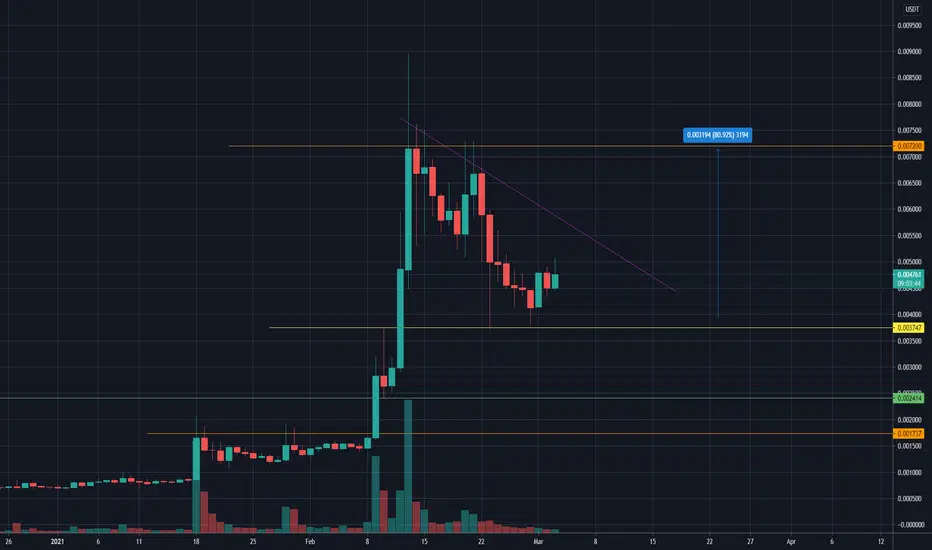
VTHO looking for a recovery.
The yellow line is indicating a possible support and resistance line.
However, this lines is very debatable which is why it's marked as yellow.
Check it out and share your thoughts.
Enjoy the ride and don't be too greedy.
If you like the content, please like, comment and give this channel a follow.
Always do your own research and keep in mind that my charts and comments cannot be considered financial advice.
Cheers
ps.
Chart explanation:
Green lines are tested support lines.
Orange lines are resistance lines or, if we are above, possible support lines which were not tested yet.
Cyan line is for volume trendline.
Purple lines are trendlines we take a look at.
Yellow lines are for visual help only.
The yellow line is indicating a possible support and resistance line.
However, this lines is very debatable which is why it's marked as yellow.
Check it out and share your thoughts.
Enjoy the ride and don't be too greedy.
If you like the content, please like, comment and give this channel a follow.
Always do your own research and keep in mind that my charts and comments cannot be considered financial advice.
Cheers
ps.
Chart explanation:
Green lines are tested support lines.
Orange lines are resistance lines or, if we are above, possible support lines which were not tested yet.
Cyan line is for volume trendline.
Purple lines are trendlines we take a look at.
Yellow lines are for visual help only.
ノート
Reached our target
免責事項
これらの情報および投稿は、TradingViewが提供または承認する金融、投資、取引、またはその他の種類の助言もしくは推奨であることを意図したものではなく、またこれらに該当するものでもありません。詳細は利用規約をご覧ください。
免責事項
これらの情報および投稿は、TradingViewが提供または承認する金融、投資、取引、またはその他の種類の助言もしくは推奨であることを意図したものではなく、またこれらに該当するものでもありません。詳細は利用規約をご覧ください。