
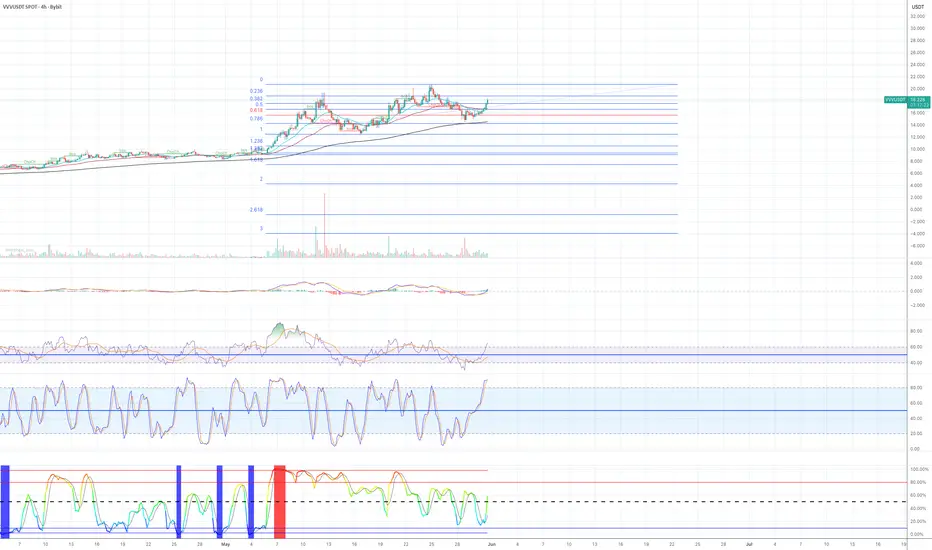
The price is continuing to form a bullish market structure, printing a series of higher highs and higher lows. After pulling back to the 0.786 Fibonacci retracement level and the EMA 200, it found strong support and is now rebounding aggressively.
Volatility,, BBWP, is beginning to expand to the upside, suggesting that a larger directional move may be developing. On the 4-hour chart, both MACD and RSI are entering bullish territory.
As long as the recent higher low remains intact, the bullish structure remains valid. The confluence of support at the 0.786 Fib level, EMA 200, expanding volatility, and improving momentum indicators presents a strong case for continued upside. Overall, the setup looks very bullish.
I bought some VVV this morning based on the technical set up.
Volatility,, BBWP, is beginning to expand to the upside, suggesting that a larger directional move may be developing. On the 4-hour chart, both MACD and RSI are entering bullish territory.
As long as the recent higher low remains intact, the bullish structure remains valid. The confluence of support at the 0.786 Fib level, EMA 200, expanding volatility, and improving momentum indicators presents a strong case for continued upside. Overall, the setup looks very bullish.
I bought some VVV this morning based on the technical set up.
トレード稼働中
P.S. I am also paying attention to the daily chart. The currently the price is trading within an ascending parallel channel. Althought th price has formed a higher high, both the daily RSI and Stochastic have developed negative divergence, suggesting that bullish momentum may be weakening. If the daily momentum indicators begin to roll over, and the price fails to break and close above 19.437 area, I plan to close my position. 
関連の投稿
免責事項
これらの情報および投稿は、TradingViewが提供または承認する金融、投資、取引、またはその他の種類の助言もしくは推奨であることを意図したものではなく、またこれらに該当するものでもありません。詳細は利用規約をご覧ください。
関連の投稿
免責事項
これらの情報および投稿は、TradingViewが提供または承認する金融、投資、取引、またはその他の種類の助言もしくは推奨であることを意図したものではなく、またこれらに該当するものでもありません。詳細は利用規約をご覧ください。