
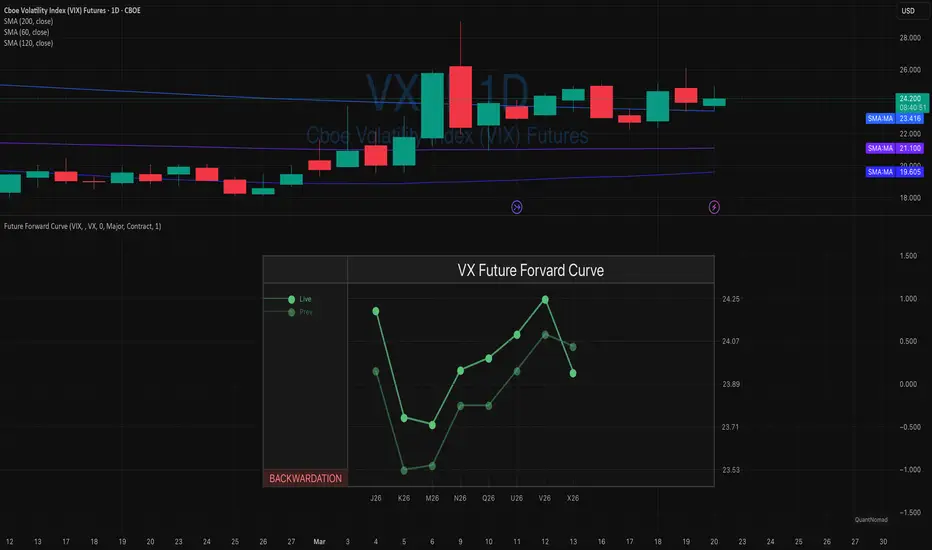
The VIX futures curve is currently extremely flat, with curve compression at ~0.55 today (vs ~0.60 yesterday) — meaning only about a $0.55 difference between the lowest and highest futures.
What makes this interesting is that it’s not easy to visually spot on a chart, but in reality, this is an unusually compressed structure for the VIX forward curve.
Such conditions are very rare, occurring in <2% of cases (~90 days since 2004).
A flat curve reflects uncertainty across maturities, where the market is pricing similar volatility regardless of time horizon.
Historically, these regimes tend not to persist and often resolve with volatility expansion.
Past examples include:
• November 2007
• October & December 2018
• March / April 2025
➡️ Not a standalone signal, but a condition to monitor
➡️ Suggests asymmetric risk toward higher volatility
Disclaimer:
This analysis is for educational purposes only and reflects personal market observations. It does not constitute investment, financial, or trading advice. Always conduct your own research before making trading decisions.

Quant Developer | Pine Script v6 | Python & R
12+ yrs in systematic trading, derivatives & hedge funds
🚀 Pro Indicators & Tools:
qntly.com/pro
💼 Quant Advisory & Development:
qntly.com/hire
12+ yrs in systematic trading, derivatives & hedge funds
🚀 Pro Indicators & Tools:
qntly.com/pro
💼 Quant Advisory & Development:
qntly.com/hire
免責事項
これらの情報および投稿は、TradingViewが提供または承認する金融、投資、取引、またはその他の種類の助言もしくは推奨であることを意図したものではなく、またこれらに該当するものでもありません。詳細は利用規約をご覧ください。