
Simple enough.
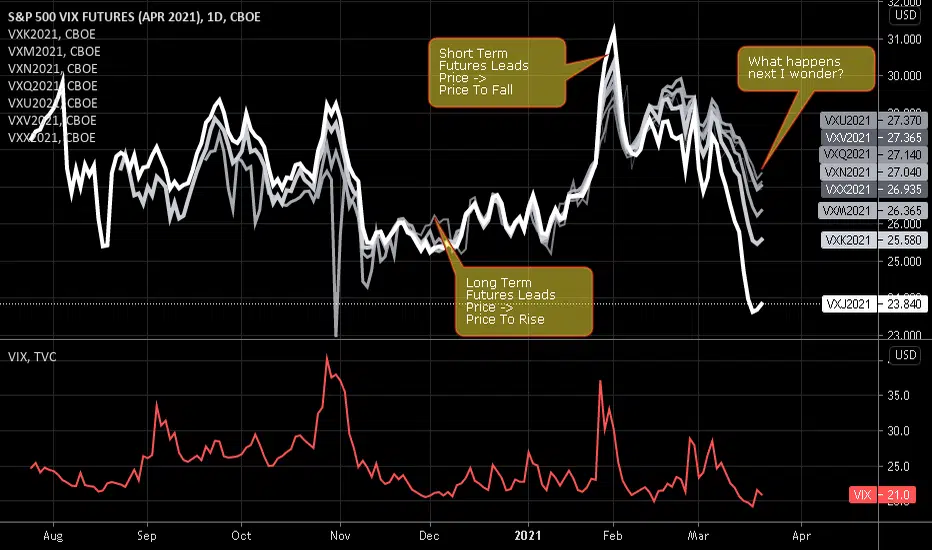
The market is showing extreme divergence between Futures contracts priced for next month, and Futures contracts priced for Q4.
This is the largest divergence seen within this Futures cycle.
My theory is that it could be indicative of a bottom in VIX and the market pricing for more serious volatility events later in the year.
Key:
Bolder, lighter lines: Near-term
Finer, darker lines: Longer-term
This utilized VIX futures priced between next month and November.
The market is showing extreme divergence between Futures contracts priced for next month, and Futures contracts priced for Q4.
This is the largest divergence seen within this Futures cycle.
My theory is that it could be indicative of a bottom in VIX and the market pricing for more serious volatility events later in the year.
Key:
Bolder, lighter lines: Near-term
Finer, darker lines: Longer-term
This utilized VIX futures priced between next month and November.

免責事項
これらの情報および投稿は、TradingViewが提供または承認する金融、投資、取引、またはその他の種類の助言もしくは推奨であることを意図したものではなく、またこれらに該当するものでもありません。詳細は利用規約をご覧ください。
免責事項
これらの情報および投稿は、TradingViewが提供または承認する金融、投資、取引、またはその他の種類の助言もしくは推奨であることを意図したものではなく、またこれらに該当するものでもありません。詳細は利用規約をご覧ください。