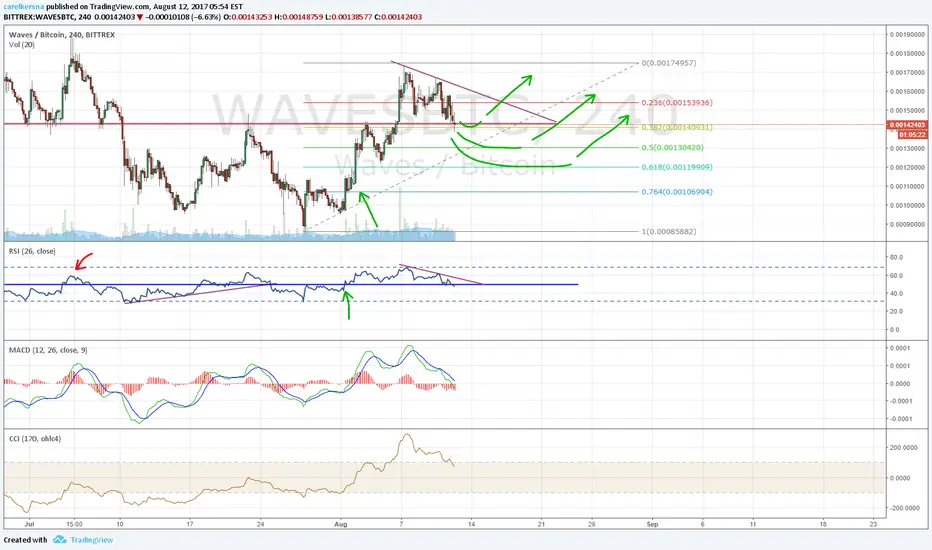
3 levels to watch.
Blue line also represents the 50 line on RSI. Expecting volatility around that level, because every time price makes a great move, RSI breaks below or above 50 level.
So as long as RSI stays above 50, its either movement to the upside or worst case sideways movement.
Blue line also represents the 50 line on RSI. Expecting volatility around that level, because every time price makes a great move, RSI breaks below or above 50 level.
So as long as RSI stays above 50, its either movement to the upside or worst case sideways movement.

免責事項
これらの情報および投稿は、TradingViewが提供または承認する金融、投資、取引、またはその他の種類の助言もしくは推奨であることを意図したものではなく、またこれらに該当するものでもありません。詳細は利用規約をご覧ください。
免責事項
これらの情報および投稿は、TradingViewが提供または承認する金融、投資、取引、またはその他の種類の助言もしくは推奨であることを意図したものではなく、またこれらに該当するものでもありません。詳細は利用規約をご覧ください。