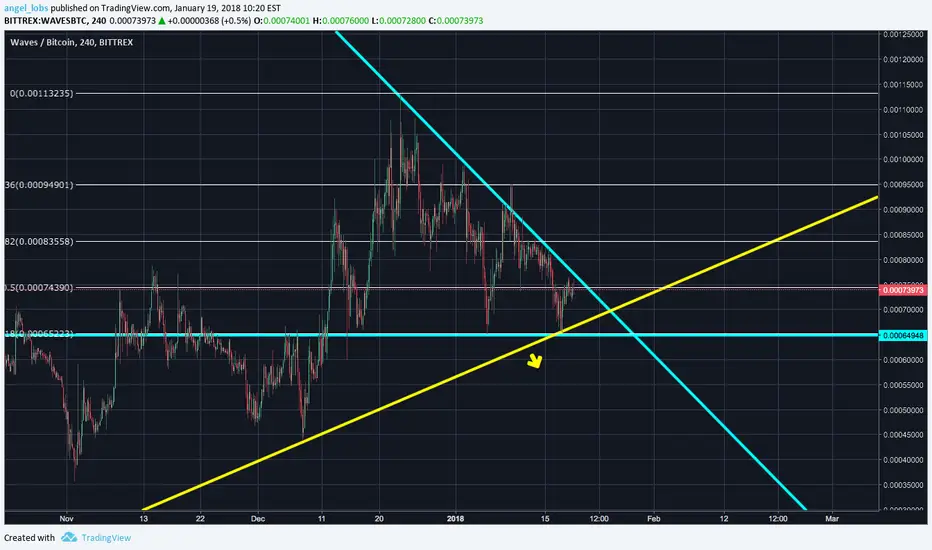
WAVESBTC is inside a "huge" symmetrical but we can see a strong support at the 0.618 Fib level, it got support there 3 times, making a triple bottom.
Because of that support we see a (Bull) Descending Triangle forming, normally this pattern indicates a drop in price (continuation of the fall) but since WAVESBTC made that triple bottom it should have "power" to break the "downtrend" line, thus meaning it could rise in price.
Careful if it drops bellow the Yellow support!
Its possible that it does another bounce then it "explodes" or one way or the other so wait for a breakout confirmation to start your positions!
Trade safe!
ノート
Wait for a confirmation on either sides! This is a Neutral trade!ノート
Careful, a BIG Head & Shoulders formed, that plus a Descending triangle, could be bad news for the Support line!
As I said this is a Neutral trade!
Wait for a confirmation of a breakout on either sides!
Trade Safe!
ノート
Ichimoku at 1D shows bearish.. Price is struggling to get inside the cloud.
Tenkan < Kijun...
You could start a Short Trade with a Stop Loss a bit up of the top of the triangle in case it fools us all and breaks upwards.
トレード稼働中
You could start a Short Trade with a Stop Loss a bit up of the top of the triangle in case it fools us all and breaks upwards.ノート
Tried to breakout upwards but it failed, it had a High of 81.2k sats but it closed on 74.5k sats.
We are bouncing downwards now.
ノート
On 4H TF kijun is at 74k sats, price should not close bellow the kijun. (for long trades)
ノート
Did 2 false breakouts already!
As you can see after the second false breakout the price got dumped really hard! Glady (for long trades) it found support inside the Ichimoku cloud at 2H
ノート
Even on the 2H chart as you can see Tenkan < Kijun so that shows bearish, lets see if the candle closes above the Cloud...手動でトレードを終了しました
Sorry to inform but this Idea will be closed so I can turn my attention to BTCUSD.Trade safe!

免責事項
これらの情報および投稿は、TradingViewが提供または承認する金融、投資、取引、またはその他の種類の助言もしくは推奨であることを意図したものではなく、またこれらに該当するものでもありません。詳細は利用規約をご覧ください。
免責事項
これらの情報および投稿は、TradingViewが提供または承認する金融、投資、取引、またはその他の種類の助言もしくは推奨であることを意図したものではなく、またこれらに該当するものでもありません。詳細は利用規約をご覧ください。