ロング
WAVES Double Bottom
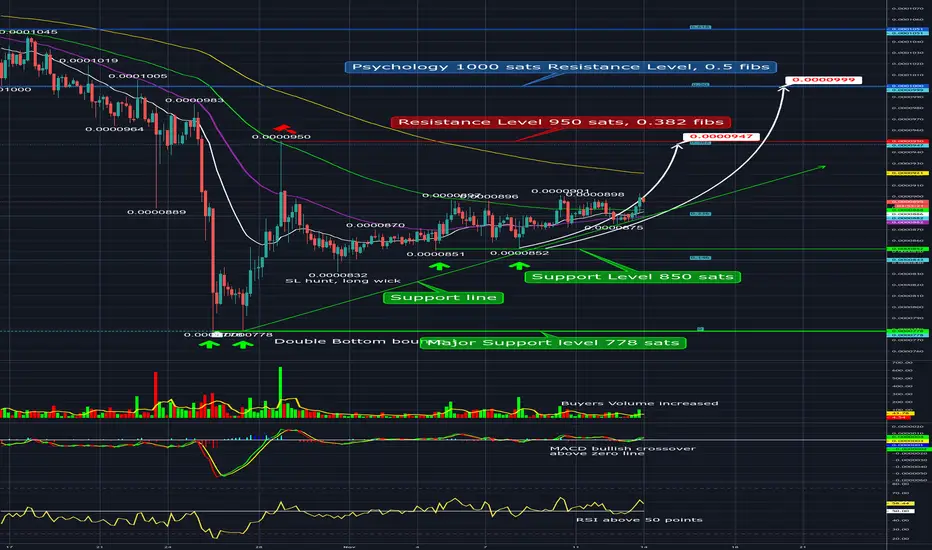
WAVES was farmed double bottom at 778 sats. Uptrend closed above EMA 21,50,100 periods. Potential retest EMA 200 at 921 sats and 0.382 fibs level 947 sats.
Was hold above green support line.
Volume: of buyers increased, confirm bullish price action.
Indicators: MACD bullish crossover above zero line. RSI above 50 points. Bullish sign.
Pattern: Double bottom at 778 sats.
S/R: Support at 850 sats, Major Support at 778 sat, Resistance at 950, Psychology Resistance 1000 sats, 0.618 sats Resistance at 1051.
Disclaimer: THIS IS NOT FINANCIAL ADVICE. All the information shared here is for learning and entertainment purposes only.

免責事項
これらの情報および投稿は、TradingViewが提供または承認する金融、投資、取引、またはその他の種類の助言もしくは推奨であることを意図したものではなく、またこれらに該当するものでもありません。詳細は利用規約をご覧ください。
免責事項
これらの情報および投稿は、TradingViewが提供または承認する金融、投資、取引、またはその他の種類の助言もしくは推奨であることを意図したものではなく、またこれらに該当するものでもありません。詳細は利用規約をご覧ください。